HowTo Generate a 3D Pie Chart of nDPI Detected Protocols
From MediaWiki
Jump to navigationJump to search
Overview

SVN: 7752
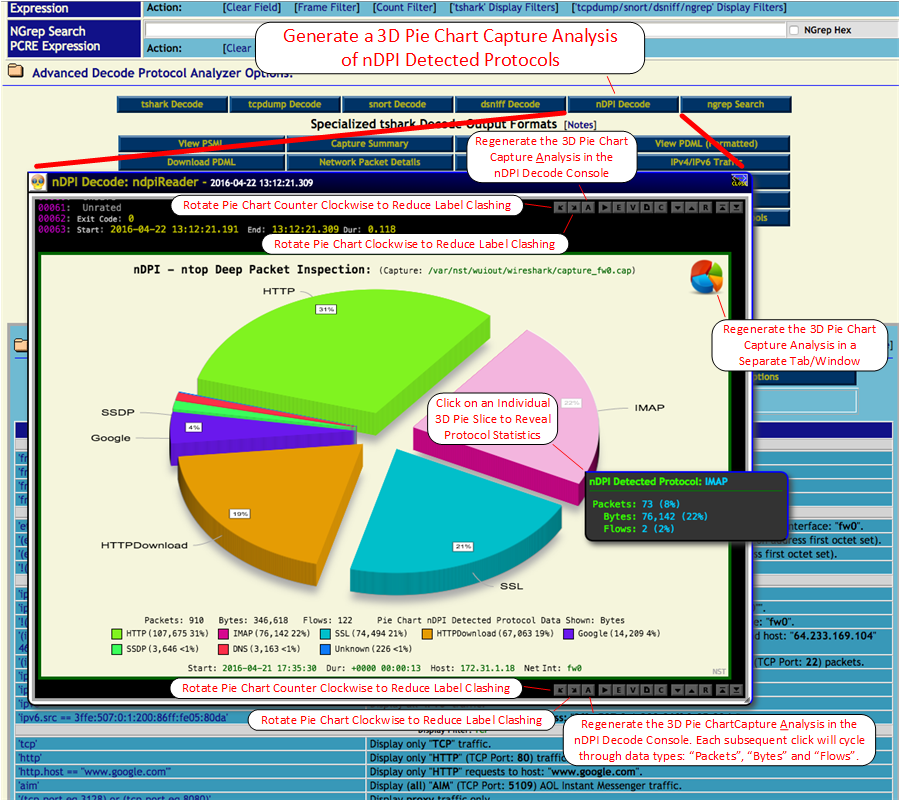
NST enhances the results generated from the ndpiReader command by visualizing the detected protocols with a 3D Pie Chart proportionally sized by their associated packet size. NST uses code from the RGraph 2D/3D Javascript Charting Project for producing the 3D Pie Chart. The ndpiReader command leverages ntop's nDPI (Deep Packet Inspection) Library to analyze a network packet capture.
The "nDPI Decode" button found in the decode section of both the Single-Tap and Multi-Tap Network Packet Capture pages is used to generate the 3D Pie Chart Capture Analysis.
Reference Diagram
The image below serves as a reference diagram for the 3D Pie Chart Capture Analysis of nDPI Detected Protocols. Interactive controls are defined in the call-outs.
