HowTo Use The NST CloudShark Upload Manager: Difference between revisions
| (88 intermediate revisions by the same user not shown) | |||
| Line 1: | Line 1: | ||
__TOC__ | __TOC__ | ||
= Overview = | = Overview = | ||
The '''NST''' project team has worked with the [http://www.cloudshark.org "'''CloudShark'''"] folks to facilitate uploading and viewing network packet captures generated by an '''NST''' system to either [http://www.cloudshark.org "'''CloudShark.org'''"] or a [http://appliance.cloudshark.org/product.html "'''CloudShark Appliance'''"]. A new CloudShark Upload Manager tool was created and embedded within the '''NST WUI''' to accomplish this. CloudShark technology allows network packet captures generated by an '''NST''' system to be imported, viewed, analyzed and shared from anywhere with a Web browser. | The '''NST''' project team has worked with the [http://www.cloudshark.org "'''CloudShark'''"] folks to facilitate uploading and viewing network packet captures generated by an '''NST''' system to either [http://www.cloudshark.org "'''CloudShark.org'''"] or a [http://appliance.cloudshark.org/product.html "'''CloudShark Appliance'''"]. A new '''CloudShark Upload Manager''' tool was created and embedded within the '''NST WUI''' to accomplish this. CloudShark technology allows network packet captures generated by an '''NST''' system to be imported, viewed, analyzed and shared from anywhere with a Web browser. CloudShark also provides a organized comprehensive method for storing and retrieval of all of your network packet captures. | ||
Both the '''NST WUI''' Single-Tap Network Packet Capture and the [[Multi-Tap_Network_Packet_Capturing | Multi-Tap Network Packet Capture]] pages as well as the [[HowTo_Use_The_NST_WUI_arp-scan_Page_To_Quickly_Locate_Hosts | Network ARP Scanner]] page have integrated the use of the '''CloudShark Upload Manager''' tool. | |||
= NST CloudShark Upload Manager Reference Diagrams = | = NST CloudShark Upload Manager Reference Diagrams = | ||
| Line 10: | Line 12: | ||
One can manually bring up the '''CloudShark Upload Manager''' widget through the '''NST Navigation Menu''' (i.e. ''Tools'' => ''Network Widgets'' => ''CloudShark Upload Manager''). All '''NST WUI''' pages that can generate a network packet capture can also bring up this widget after a capture has been obtained (i.e., ''Currently'', both the Single and Multi-Tap Network Packet Capture pages as well as the Network ARP Scanner page have this capability.). If the "'''Automatic Upload Option'''" is ''enabled'', then the '''CloudShark Upload Manager's''' internal transfer process is only used without actually bringing up the widget when uploading a capture from these pages. If the "'''View Option'''" is also ''enabled'', then your browser will ''automatically'' open up a new tab/window and try to "'''View'''" the newly uploaded capture on the associated "'''CloudShark'''" host after the capture was successfully transferred. | One can manually bring up the '''CloudShark Upload Manager''' widget through the '''NST Navigation Menu''' (i.e. ''Tools'' => ''Network Widgets'' => ''CloudShark Upload Manager''). All '''NST WUI''' pages that can generate a network packet capture can also bring up this widget after a capture has been obtained (i.e., ''Currently'', both the Single and Multi-Tap Network Packet Capture pages as well as the Network ARP Scanner page have this capability.). If the "'''Automatic Upload Option'''" is ''enabled'', then the '''CloudShark Upload Manager's''' internal transfer process is only used without actually bringing up the widget when uploading a capture from these pages. If the "'''View Option'''" is also ''enabled'', then your browser will ''automatically'' open up a new tab/window and try to "'''View'''" the newly uploaded capture on the associated "'''CloudShark'''" host after the capture was successfully transferred. | ||
The diagram below references each component and action available on the '''CloudShark Upload Manager''' widget. The | The diagram below references each component and action available on the '''CloudShark Upload Manager''' widget. The manager is shown with the '''Access Control Panel''' in view. Use the '''Access Control Panel''' to define a ''new'' "'''Target'''" for each "'''CloudShark Appliance'''" to connect to. A "'''Target'''" is a configured access control group that ''defines'' how a network packet capture is ''uploaded'' to a "'''CloudShark'''" host. Tool tips are also provided on the '''NST WUI''' for each component and action providing detailed information and usage. | ||
== NST CloudShark Upload Manager & Access Control Reference Diagram == | == NST CloudShark Upload Manager & Access Control Reference Diagram == | ||
[[Image:Nst_cloudshark_ref1.png| | [[Image:Nst_cloudshark_ref1.png|1024px|center|NST CloudShark Upload Manager & Access Control Reference Diagram]] | ||
| | ||
== NST CloudShark Upload Manager View Captures Reference Diagram == | == NST CloudShark Upload Manager View Captures Reference Diagram == | ||
The diagram below references the "'''View Captures'''" selection pull down panel. The panel is composed of two (2) sections. One for ''actions'' and one for ''viewing'' previously uploaded captures. Each action is described in the diagram below. A "'''CloudShark Capture Upload History '''" widget is also shown which was ''revealed'' by clicking on the "'''View Capture Upload History List'''" action. One can then copy an individual capture access '''URL''' or all of them and then share this information via Email with a colleague for a joint capture protocol analysis session using a web browser. | |||
[[Image:Nst_cloudshark_ref2.png| | When a new capture is successfully uploaded to a "'''CloudShark'''" host, it is also added to the "'''View Captures'''" panel for accessing it at a later time. | ||
[[Image:Nst_cloudshark_ref2.png|1024px|center|NST CloudShark View Captures Reference Diagram]] | |||
| | ||
= NST & CloudShark Use Case: Multi-Tap Network Packet Capture Setup = | = NST & CloudShark Use Case: Multi-Tap Network Packet Capture Setup = | ||
The network diagram below demonstrates how one could setup an '''NST''' system to perform a '''Multi-Tap Network Packet Capture''' session and use '''CloudShark Technology''' in the backend for capture storage, management and protocol analysis. In this example, '''Web Server 4''' packets (Interface: '''p1p2''') combined with '''All DMZ WAN''' packets (Interface: '''p5p1''') will be captured by this Multi-Tap setup. This configuration can be useful for diagnosing both '''IPv4 Address''' and '''Port''' translations (i.e. '''NAT''' and '''PAT''' respectively) through the '''DMZ Firewall''' and also server response times for '''HTTP/HTTPS''' network traffic. | |||
[[Image:Nst_cloudshark_multitap.png| | [[Image:Nst_cloudshark_multitap.png|1024px|center|NST & CloudShark: Multi-Tap Network Packet Capture Setup]] | ||
| | ||
= NST & CloudShark Use Case: Single-Tap Network Packet Capture Analysis In A Web Browser = | = NST & CloudShark Use Case: Single-Tap Network Packet Capture Analysis In A Web Browser = | ||
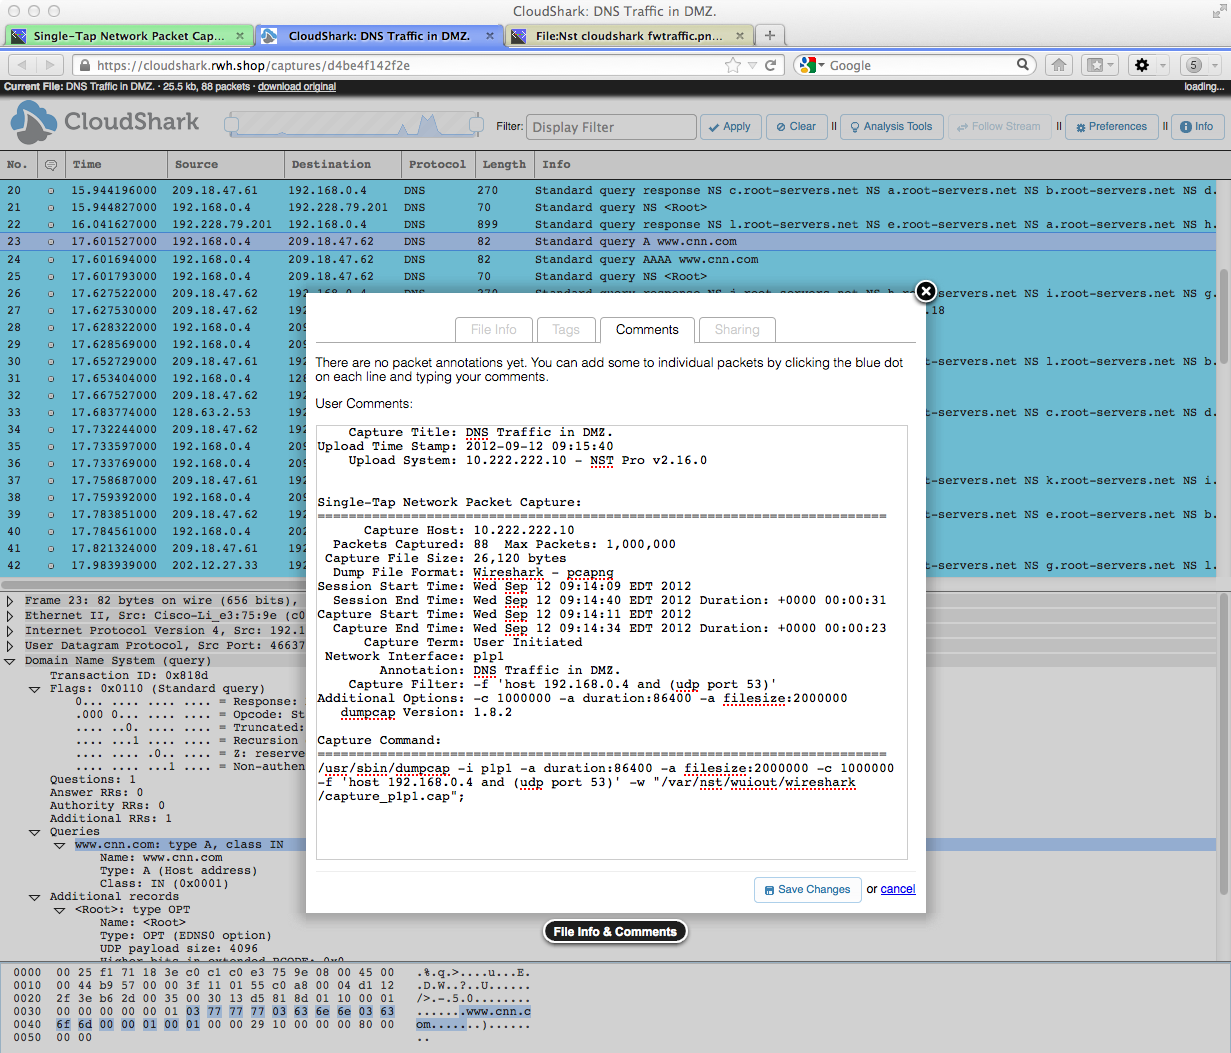
The image below shows a '''CloudShark''' packet decode presented the '''Chrome''' web browser with the "'''Info'''" window pop-up highlighted. | |||
The "'''Comments'''" tab was selected and shows pertinent information describing the complete genesis of the capture including the capture filter and the command line used to generate it. This information was transmitted along with the capture upload process by the '''Nst CloudShark Upload Manager'''. This additional information is now a permanent record that is attached to the capture and is managed by '''CloudShark's''' storage and retrieval capability. | |||
For post-decode analysis it is ''very'' important to know the following additional information about a network packet capture: | |||
* How was the capture generated. | |||
* What was the content of the capture (Annotation). | |||
* Where there any capture filters used. | |||
* Both capture duration as well as session duration. | |||
* How was the capture terminated (Term). | |||
* Knowledge of the capture tool options (e.g., What capture tool and version was used, Network Interfaces used, Termination Thresholds used, etc...) | |||
In this example, an '''NST Single-Tap Network Packet Capture''' was uploaded to the '''CloudShark Appliance''' to collect DNS traffic in the '''DMZ'''. The packet for a DNS "'''A'''" Record Query for Host: "'''www.cnn.com'''" is shown decoded. Note that this capture was ''terminated'' by the user and not by the capture termination thresholds. | |||
[[Image:Nst_cloudshark_fwtraffic.png|940px|center|frame|NST & CloudShark: Single-Tap Network Packet Capture Analysis]] | [[Image:Nst_cloudshark_fwtraffic.png|940px|center|frame|NST & CloudShark: Single-Tap Network Packet Capture Analysis]] | ||
| Line 37: | Line 56: | ||
= NST & CloudShark Use Case - Graph Analysis: Captured Bytes vs Time = | = NST & CloudShark Use Case - Graph Analysis: Captured Bytes vs Time = | ||
The image below shows and example of a '''CloudShark''' analysis tool which runs in the web browser. This tools shows actual packet bytes as a function of time (i.e. Bandwidth). One can use the '''slider''' widget to control the viewing area of interest. | |||
[[Image:Nst_cloudshark_graph.png|940px|center|frame|CloudShark - Graph Analysis: Captured Bytes vs Time ]] | [[Image:Nst_cloudshark_graph.png|940px|center|frame|CloudShark - Graph Analysis: Captured Bytes vs Time ]] | ||
| | ||
Latest revision as of 06:43, 19 September 2012
Overview
The NST project team has worked with the "CloudShark" folks to facilitate uploading and viewing network packet captures generated by an NST system to either "CloudShark.org" or a "CloudShark Appliance". A new CloudShark Upload Manager tool was created and embedded within the NST WUI to accomplish this. CloudShark technology allows network packet captures generated by an NST system to be imported, viewed, analyzed and shared from anywhere with a Web browser. CloudShark also provides a organized comprehensive method for storing and retrieval of all of your network packet captures.
Both the NST WUI Single-Tap Network Packet Capture and the Multi-Tap Network Packet Capture pages as well as the Network ARP Scanner page have integrated the use of the CloudShark Upload Manager tool.
NST CloudShark Upload Manager Reference Diagrams

SVN: 4104
The NST WUI has an integrated "CloudShark Upload Manager" network tools widget for managing the process of transferring a network packet capture to either "CloudShark.org" or a "CloudShark Appliance". The Upload Manager can be configured for either manual or automatic capture uploading and viewing.
One can manually bring up the CloudShark Upload Manager widget through the NST Navigation Menu (i.e. Tools => Network Widgets => CloudShark Upload Manager). All NST WUI pages that can generate a network packet capture can also bring up this widget after a capture has been obtained (i.e., Currently, both the Single and Multi-Tap Network Packet Capture pages as well as the Network ARP Scanner page have this capability.). If the "Automatic Upload Option" is enabled, then the CloudShark Upload Manager's internal transfer process is only used without actually bringing up the widget when uploading a capture from these pages. If the "View Option" is also enabled, then your browser will automatically open up a new tab/window and try to "View" the newly uploaded capture on the associated "CloudShark" host after the capture was successfully transferred.
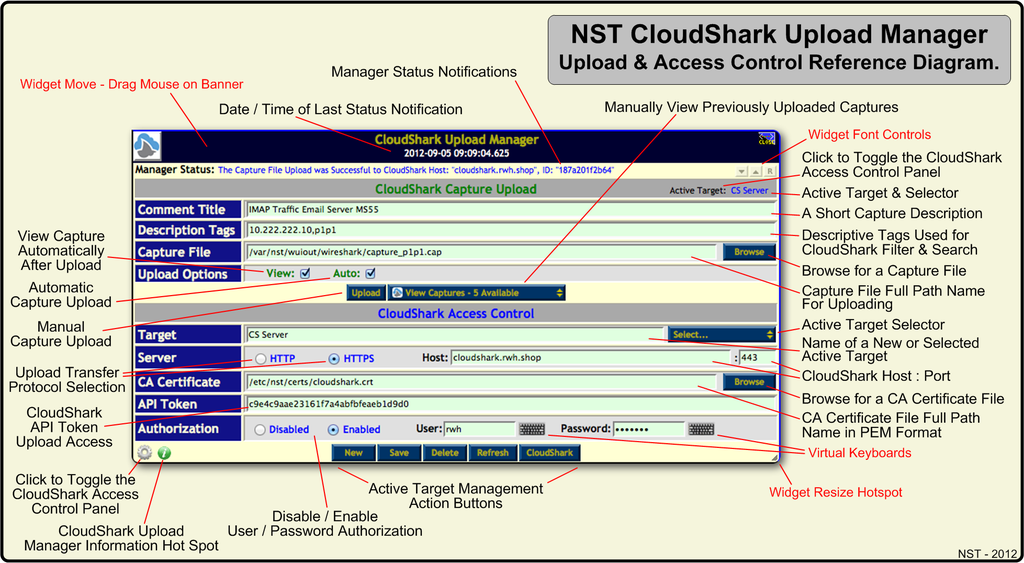
The diagram below references each component and action available on the CloudShark Upload Manager widget. The manager is shown with the Access Control Panel in view. Use the Access Control Panel to define a new "Target" for each "CloudShark Appliance" to connect to. A "Target" is a configured access control group that defines how a network packet capture is uploaded to a "CloudShark" host. Tool tips are also provided on the NST WUI for each component and action providing detailed information and usage.
NST CloudShark Upload Manager & Access Control Reference Diagram
NST CloudShark Upload Manager View Captures Reference Diagram
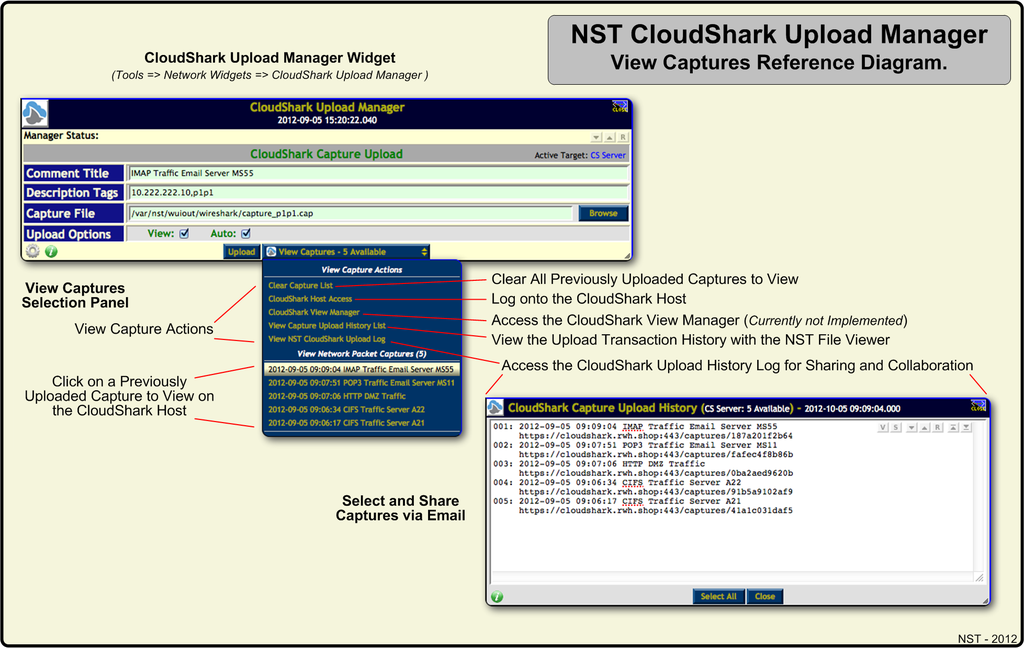
The diagram below references the "View Captures" selection pull down panel. The panel is composed of two (2) sections. One for actions and one for viewing previously uploaded captures. Each action is described in the diagram below. A "CloudShark Capture Upload History " widget is also shown which was revealed by clicking on the "View Capture Upload History List" action. One can then copy an individual capture access URL or all of them and then share this information via Email with a colleague for a joint capture protocol analysis session using a web browser.
When a new capture is successfully uploaded to a "CloudShark" host, it is also added to the "View Captures" panel for accessing it at a later time.
NST & CloudShark Use Case: Multi-Tap Network Packet Capture Setup
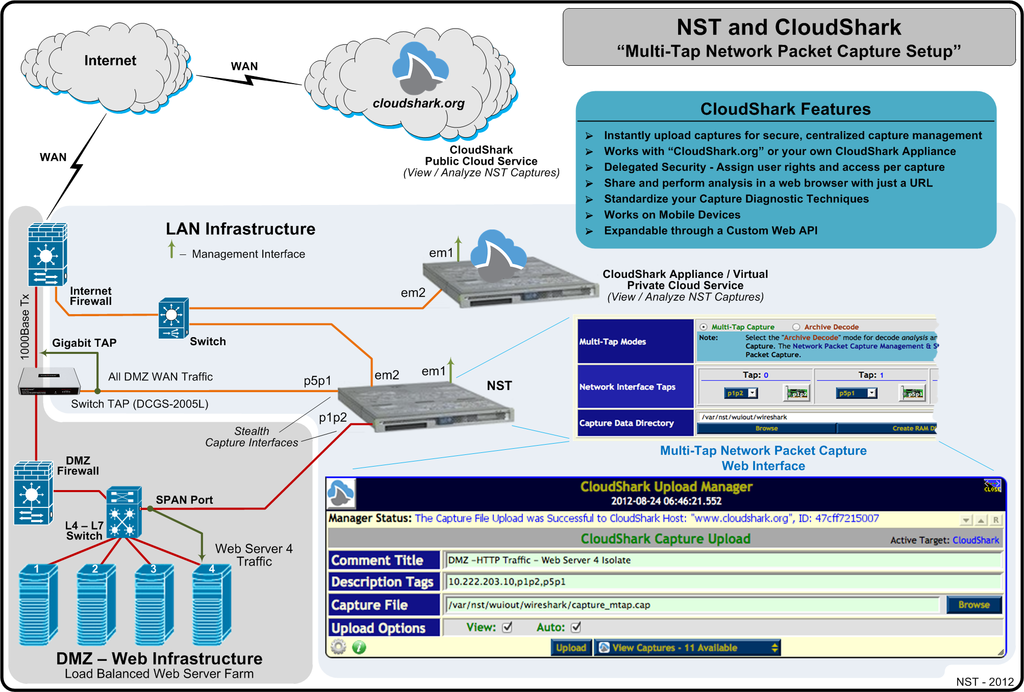
The network diagram below demonstrates how one could setup an NST system to perform a Multi-Tap Network Packet Capture session and use CloudShark Technology in the backend for capture storage, management and protocol analysis. In this example, Web Server 4 packets (Interface: p1p2) combined with All DMZ WAN packets (Interface: p5p1) will be captured by this Multi-Tap setup. This configuration can be useful for diagnosing both IPv4 Address and Port translations (i.e. NAT and PAT respectively) through the DMZ Firewall and also server response times for HTTP/HTTPS network traffic.
NST & CloudShark Use Case: Single-Tap Network Packet Capture Analysis In A Web Browser
The image below shows a CloudShark packet decode presented the Chrome web browser with the "Info" window pop-up highlighted. The "Comments" tab was selected and shows pertinent information describing the complete genesis of the capture including the capture filter and the command line used to generate it. This information was transmitted along with the capture upload process by the Nst CloudShark Upload Manager. This additional information is now a permanent record that is attached to the capture and is managed by CloudShark's storage and retrieval capability.
For post-decode analysis it is very important to know the following additional information about a network packet capture:
- How was the capture generated.
- What was the content of the capture (Annotation).
- Where there any capture filters used.
- Both capture duration as well as session duration.
- How was the capture terminated (Term).
- Knowledge of the capture tool options (e.g., What capture tool and version was used, Network Interfaces used, Termination Thresholds used, etc...)
In this example, an NST Single-Tap Network Packet Capture was uploaded to the CloudShark Appliance to collect DNS traffic in the DMZ. The packet for a DNS "A" Record Query for Host: "www.cnn.com" is shown decoded. Note that this capture was terminated by the user and not by the capture termination thresholds.
NST & CloudShark Use Case - Graph Analysis: Captured Bytes vs Time
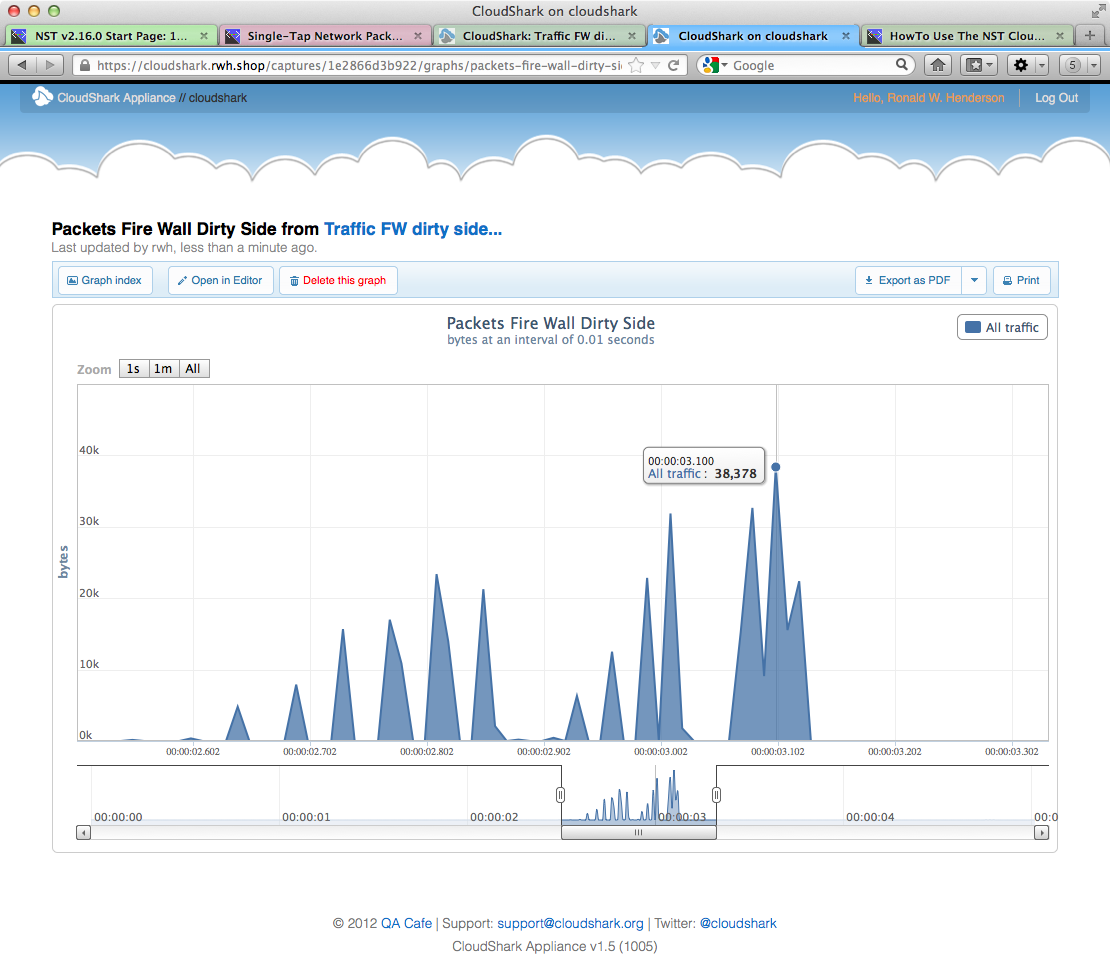
The image below shows and example of a CloudShark analysis tool which runs in the web browser. This tools shows actual packet bytes as a function of time (i.e. Bandwidth). One can use the slider widget to control the viewing area of interest.
