Difference between revisions of "NST Network Interface Bandwidth Monitor"
From NST Wiki
Jump to navigationJump to search (→Feature Summary) |
(→Overview) |
||
| Line 2: | Line 2: | ||
= '''Overview''' = | = '''Overview''' = | ||
| − | The NST Network Interface Bandwidth Monitor is an interactive dynamic [http://en.wikipedia.org/wiki/Scalable_Vector_Graphics '''SVG''']/[http://en.wikipedia.org/wiki/Ajax_(programming) '''AJAX'''] enabled application integrated into the [[Getting_Started#NST_Web_User_Interface_.28WUI.29 | '''NST''' '''WUI''']] for ''monitoring'' Network Bandwidth usage on each configured network interface in pseudo real-time. The image below is an example display of the bandwidth monitoring application for network interface: "'''eth0'''". Also shown is | + | The NST Network Interface Bandwidth Monitor is an interactive dynamic [http://en.wikipedia.org/wiki/Scalable_Vector_Graphics '''SVG''']/[http://en.wikipedia.org/wiki/Ajax_(programming) '''AJAX'''] enabled application integrated into the [[Getting_Started#NST_Web_User_Interface_.28WUI.29 | '''NST''' '''WUI''']] for ''monitoring'' Network Bandwidth usage on each configured network interface in pseudo real-time. The image below is an example display of the bandwidth monitoring application for network interface: "'''eth0'''". Also shown is an included '''Ruler Measurement''' tool overlay to perform time and bandwidth rate analysis. |
[[File:Thunderbolt.png|frame|left|'''[[Feature Release Symbol | <center>NST 2.15.0<br /> SVN: 2502</center>]]''']] [[Image:Nstbwmon1.png|center|frame|Network Interface Bandwidth Monitor - Single Interface: eth0]] | [[File:Thunderbolt.png|frame|left|'''[[Feature Release Symbol | <center>NST 2.15.0<br /> SVN: 2502</center>]]''']] [[Image:Nstbwmon1.png|center|frame|Network Interface Bandwidth Monitor - Single Interface: eth0]] | ||
Revision as of 10:32, 10 August 2011
Contents
Overview
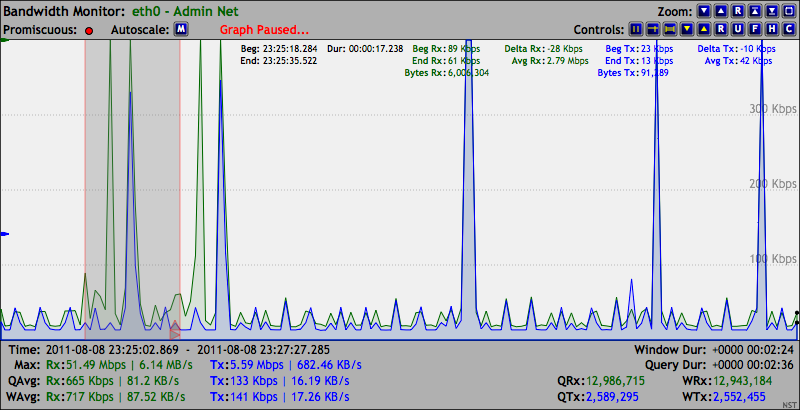
The NST Network Interface Bandwidth Monitor is an interactive dynamic SVG/AJAX enabled application integrated into the NST WUI for monitoring Network Bandwidth usage on each configured network interface in pseudo real-time. The image below is an example display of the bandwidth monitoring application for network interface: "eth0". Also shown is an included Ruler Measurement tool overlay to perform time and bandwidth rate analysis.
Feature Summary
The following are key features of the NST Network Interface Bandwidth Monitor tool:
- Graphically monitor Network Bandwidth rates on each configured network interface within the NST WUI.
- User selectable network interface network interface to monitor.
- Interactive display using dynamic SVG (Scalable Vector Graphics).
- User selectable AJAX query updates providing a pseudo real-time Bandwidth Rate presentation.
- Automatic and manual bandwidth rate scale adjustments.
- Pause individual graphs for analysis or synchronization both Received/Transmit graphs when using a TAP for monitoring.
- Adjustable graph dimensions for long duration bandwidth monitoring.
- Graph controls for visual appearance including fill and opacity setting.
- Zoom controls for graph size enlargement and Full Screen viewing.
- Crosshairs overlay for exploring time and bandwidth values.
- A Ruler Measurement tool overlay for time and bandwidth rate analysis.
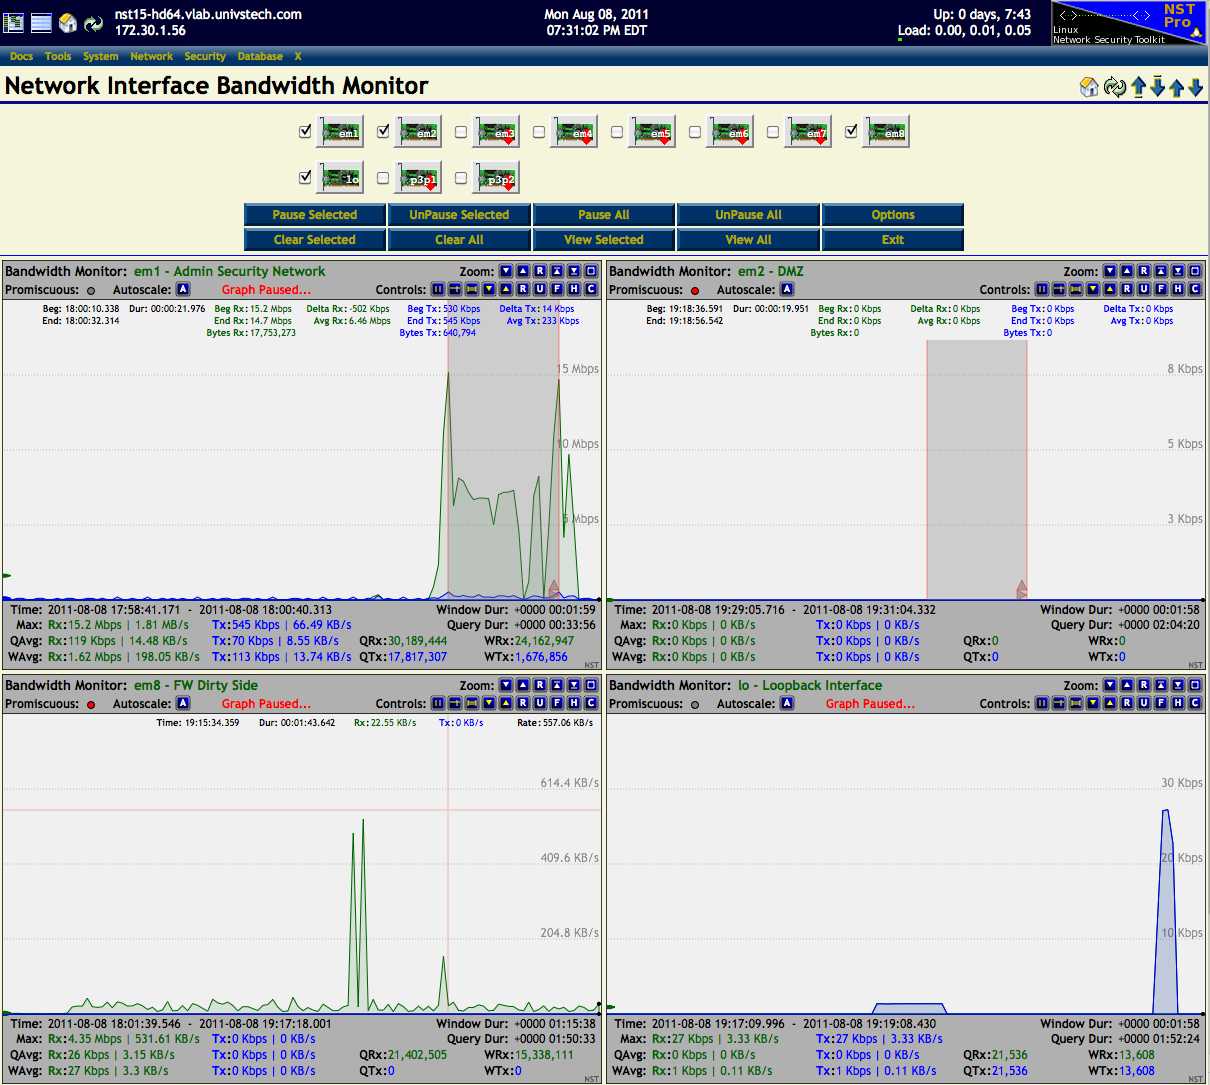
This example shows the bandwidth monitoring application for selected network interfaces: "em1, em2, em8 and lo" on a NST system configured with eleven (11) network interfaces.


