LAN Ethernet Maximum Rates, Generation, Capturing & Monitoring
Contents
- 1 Overview
- 2 Ethernet Maximum Rates
- 3 Ethernet Frame Rate & Data Measurements Network Configuration
- 4 Packet Generators, Packet Capture Tools & Network Monitors
- 5 Maximum Gigabit Ethernet Data Rate Measurement
- 6 Maximum Gigabit Ethernet Frame Rate Measurement
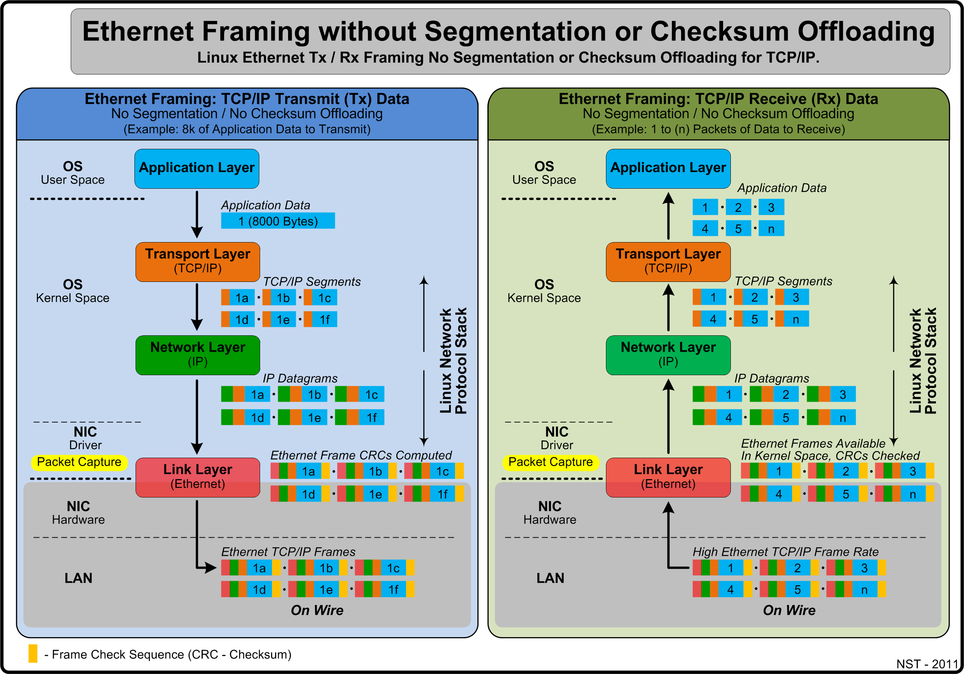
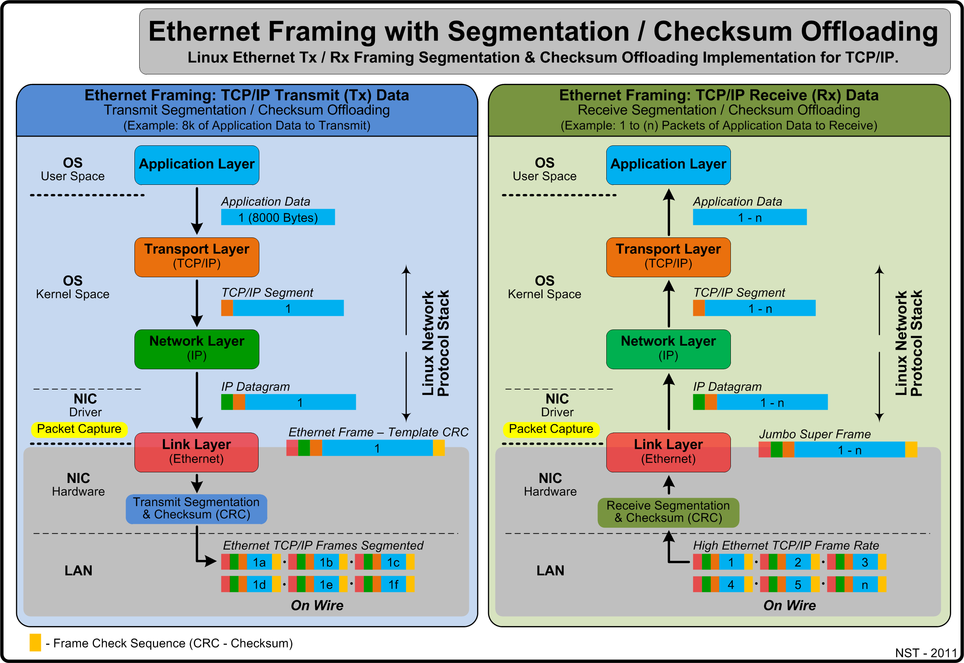
- 7 Ethernet Framing - Segmentation & Checksum (CRC) Offloading
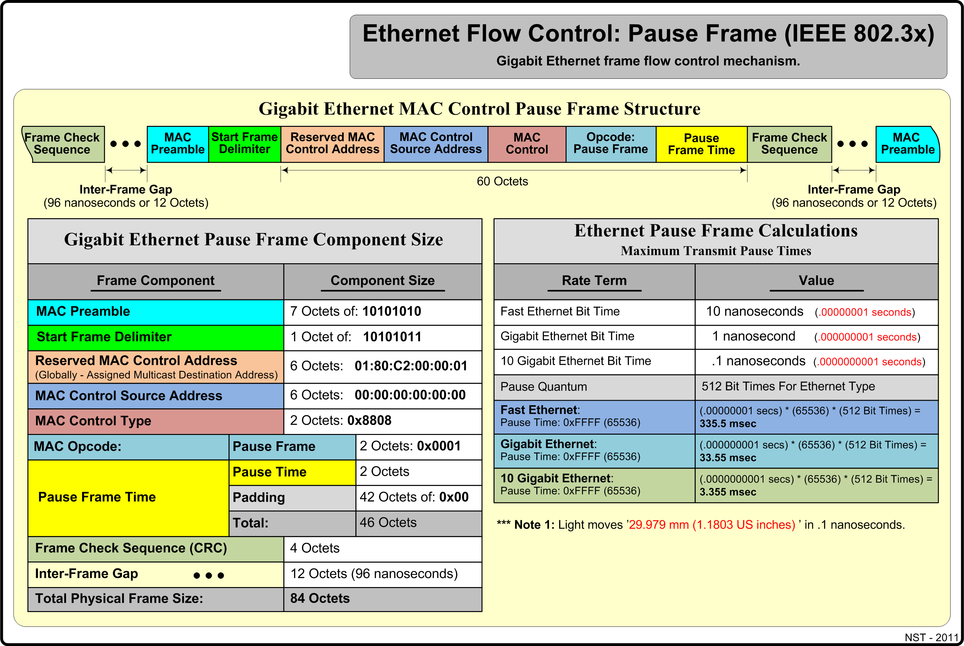
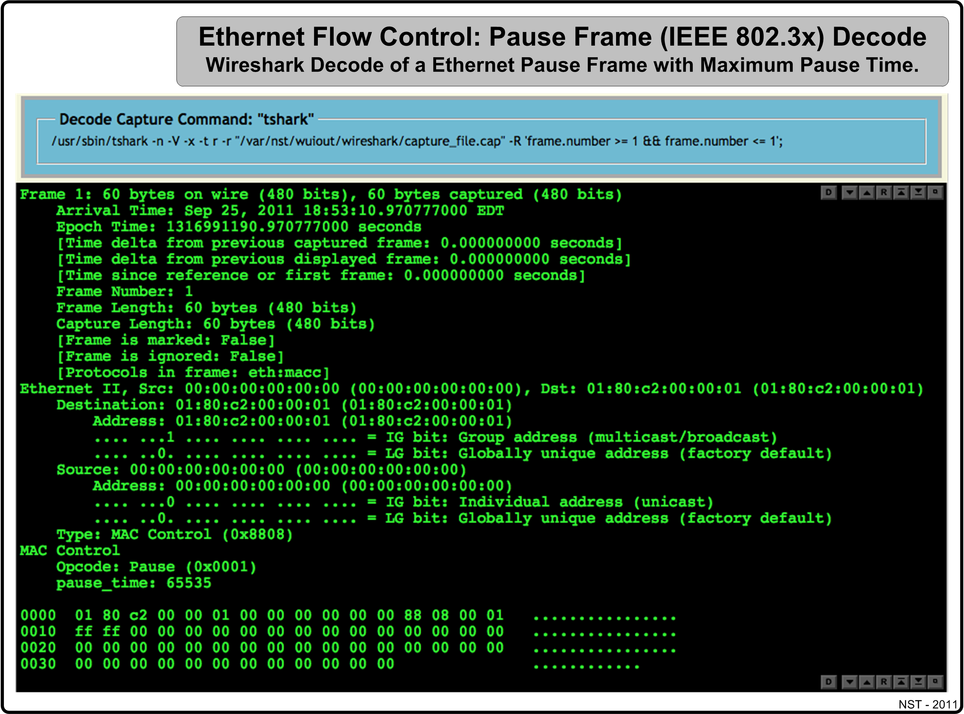
- 8 Ethernet Flow Control Pause Frame (IEEE 802.3x)
Overview
Designing and managing an IP network requires an in-depth understanding of both the network infrastructure and the performance of devices that are attached, including how packets are handled by each network device. Network computing engineers most often refer to the performance of network devices by using the speed of the interfaces expressed in bits per second (bps). For example, a network device may be described as having a performance of 10 gigabits per second (Gbps). Although this is useful and important information, expressing performance in terms of bps alone does not adequately cover other important network device performance metrics. Determining effective data rates for varying Ethernet packets sizes can provide vital information and a more complete understanding of the characteristics of the network.
It is the intent of this article to measure maximum LAN Ethernet rates values that can be achieved for both Fast Ethernet and Gigabit Ethernet using the TCP/IP or the UDP network protocols. A stepwise approach on how to generate, capture and monitor maximum Ethernet rates will be shown using various tools bundled with the Network Security Toolkit (NST). We will follow many of the methods described in RFC 2544 "Benchmarking Methodology for Network Interconnect Devices" to perform benchmark tests and performance measurements.
A demonstration and discussion on how Linux segmentation off-loading for supported NIC adapters can produce Super Ethernet Frames will be presented. These large Ethernet frames can be captured and decoded by the network protocol analyzer. The use of segmentation off-loading can result in increased network performance and less CPU overhead for network packet processing. Finally, a section on Ethernet flow control (IEEE 802.3x) will be review and its effects during high data transfer rates will be revealed.
Ethernet Maximum Rates
Ethernet Background Information
To get started, some background information is appropriate. Communication between computer systems using TCP/IP takes place through the exchange of packets. A packet is a PDU (Protocol Data Unit) at the IP layer. The PDU at the TCP layer is called a segment while a PDU at the data-link layer (such as Ethernet) is called a frame. However the term packet is generically used to describe the data unit that is exchanged between TCP/IP layers as well as between two computers.
First, one needs to know the maximum performance of the network environment to establish a baseline value. We will be using a Switched Gigabit Ethernet (IEEE 802.3ab) network configuration. We chose this configuration because it is a typical network topology used in today's enterprise inter-networking environments.
Frames per second (FPS), Packets per second (PPS) or Bits per second (bps) are a common methods of rating the throughput performance of a network device. Understanding how to calculate these rates can provide extensive insight on how the Ethernet system functions and will help assist in network architecture design.
The following sections show the theoretical maximum frames per second that can be achieved using Fast Ethernet (100 Mb/sec) and Gigabit Ethernet (1000 Mb/sec) for the TCP/IP and UDP network protocols. Today's network switches and systems configured with commodity based network NIC adapters allow these theoretical limits to be reached.
Fast Ethernet Using TCP/IP
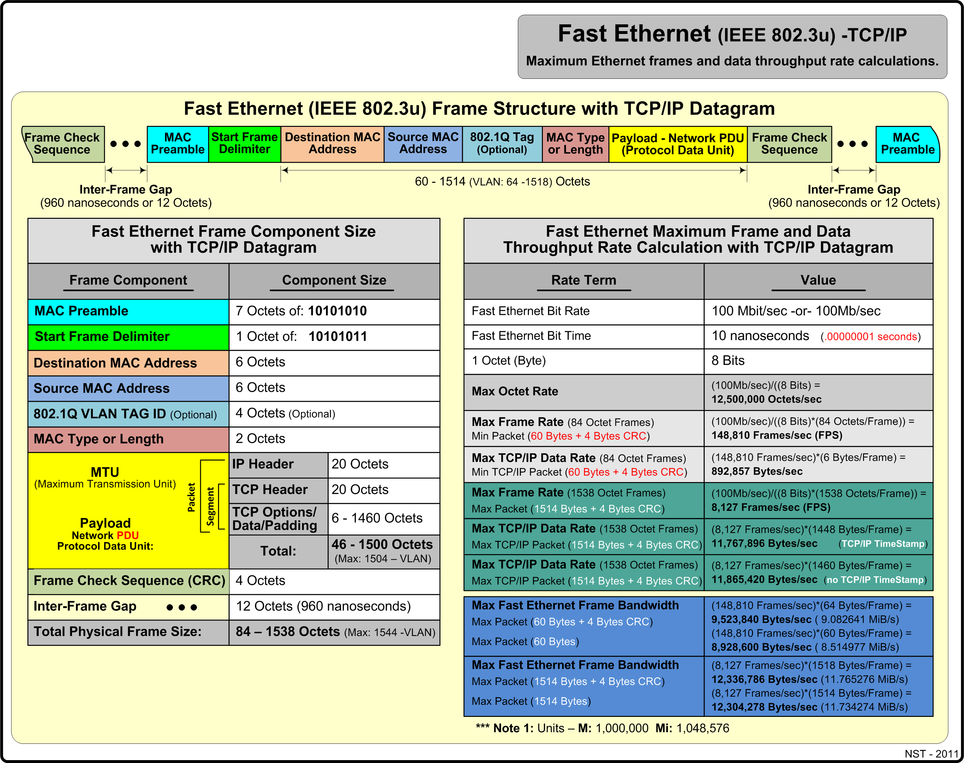
The diagram below presents maximum Fast Ethernet (IEEE 802.3u) metrics and reference values for the TCP/IP network protocol using minimum and maximum payload sizes.
Fast Ethernet Using UDP
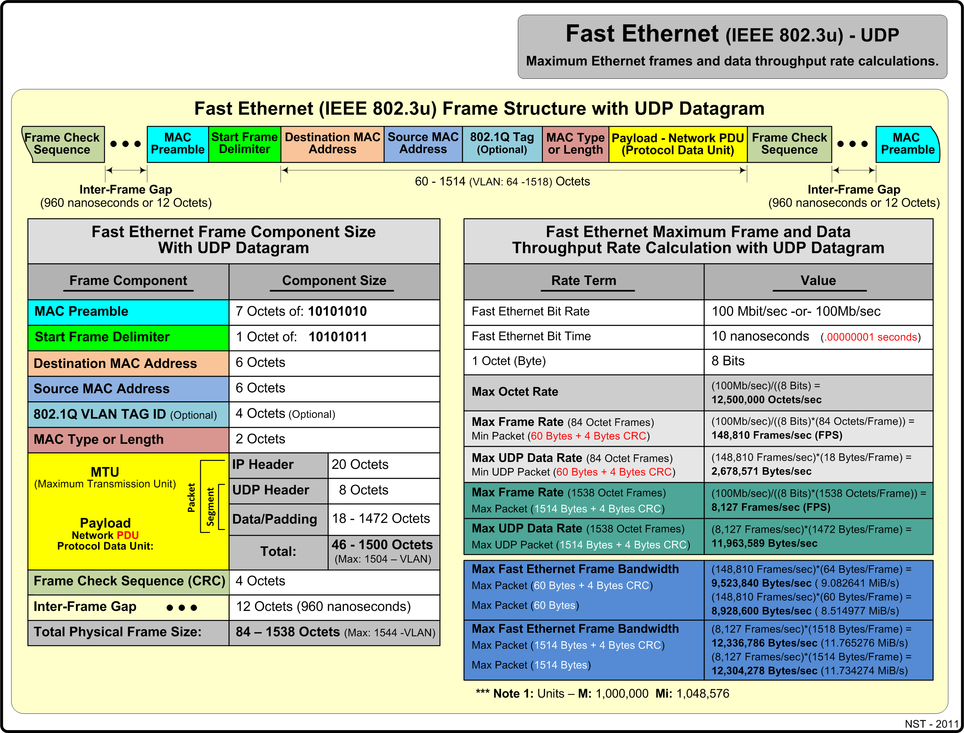
The diagram below presents maximum Fast Ethernet (IEEE 802.3u) metrics and reference values for the UDP network protocol using minimum and maximum payload sizes.
Gigabit Ethernet Using TCP/IP
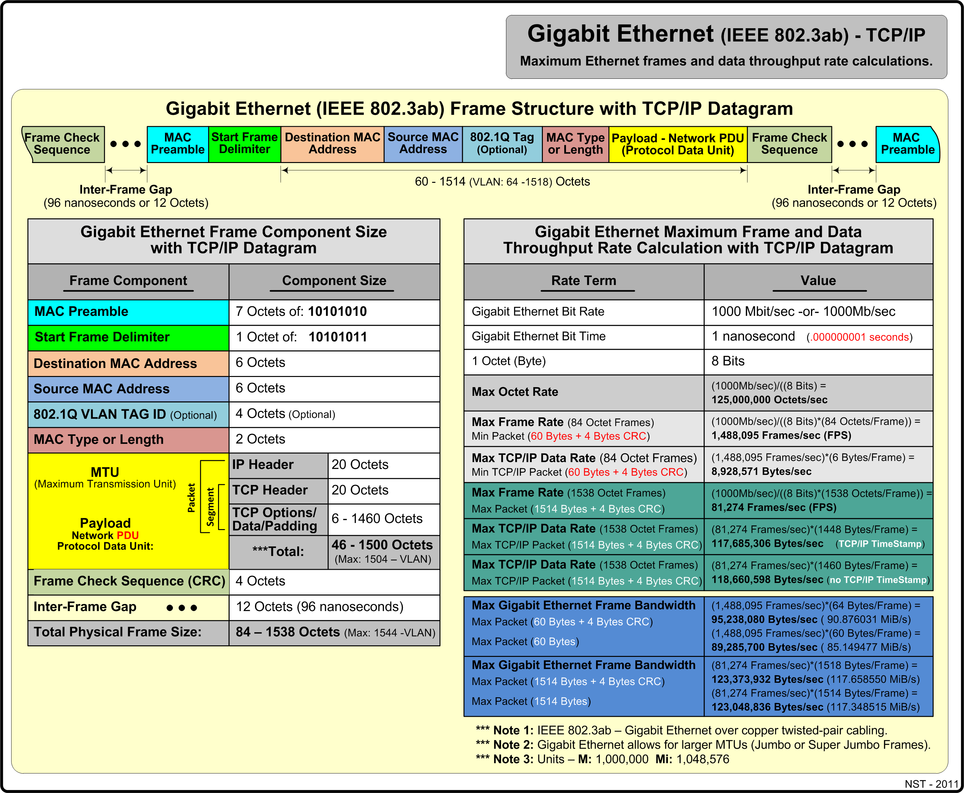
The diagram below presents maximum Gigabit Ethernet (IEEE 802.3ab) metrics and reference values for the TCP/IP network protocol using minimum and maximum payload sizes.
Gigabit Ethernet Using UDP
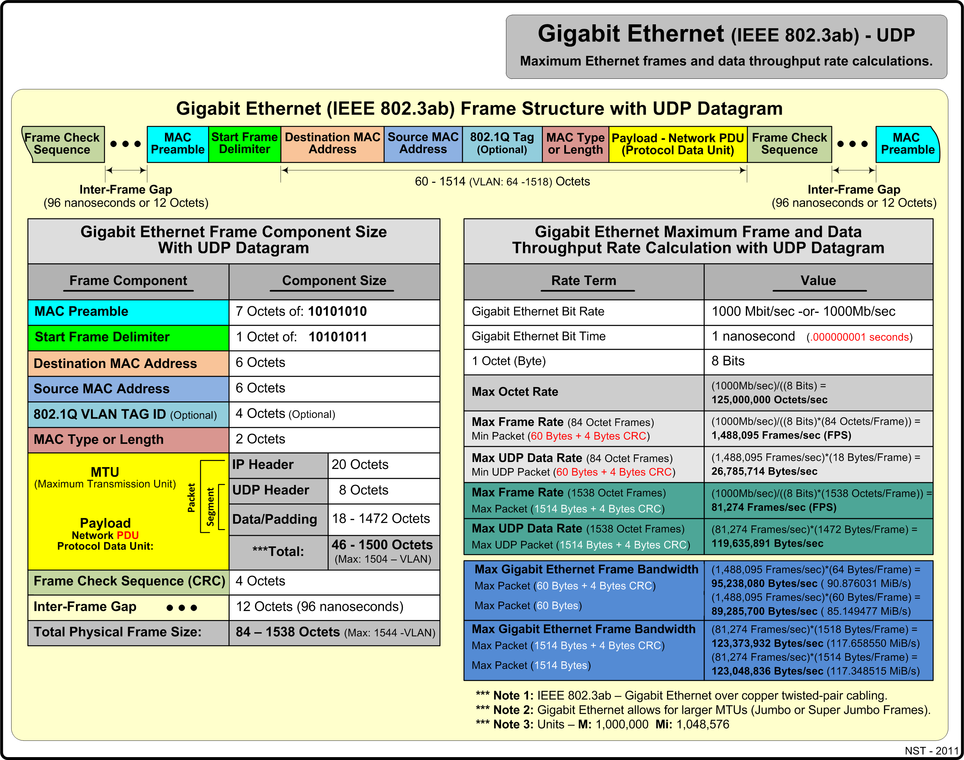
The diagram below presents maximum Gigabit Ethernet (IEEE 802.3ab) metrics and reference values for the UDP network protocol using minimum and maximum payload sizes.
Ethernet Frame Rate & Data Measurements Network Configuration
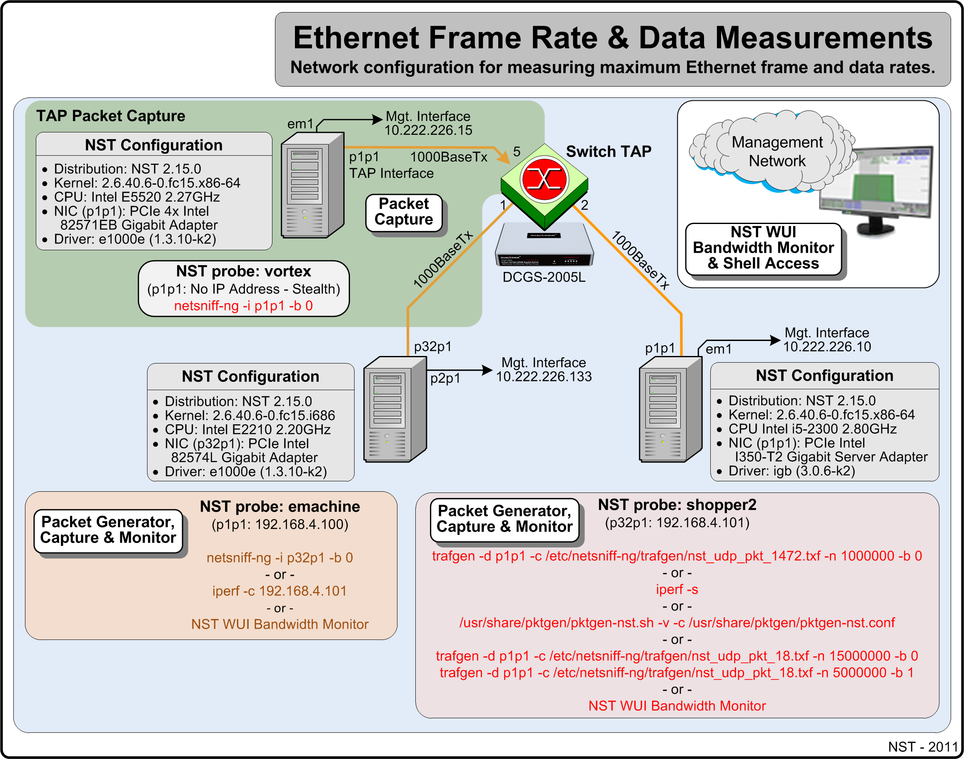
The Gigabit network diagram below is used as the reference network for bandwidth performance measurements made throughout this article. Each system shown below is a commodity based system that can be purchased at a local retailer. Both the emachine and the shopper2 system are configured as NST probes and attached to the Gigabit Ethernet network via a Dualcomm DGCS-2005L Gigabit Switch TAP. This allows port: 5 of the TAP to be used as a SPAN port for system vortex to perform network packet capture on interface: "p1p1". System configurations, functionality and network performance measurement tools with command line arguments are also displayed. A separate out-of-band management network is configured for NST WUI usage and Shell command line access.
Packet Generators, Packet Capture Tools & Network Monitors
Networking tools used in this article for performance bandwidth measurements will now be explained. Each tool described is bundled with the NST distribution.
Packet Generators
pktgen
pktgen is a Linux packet generator that can produce network packets at very high speed in the kernel. The tool is implemented as a Linux module. NST has package this tool as an RPM with a front-end wrapper script: "/usr/share/pktgen/pktgen-nst.sh" and starter configuration file: "/usr/share/pktgen/pktgen-nst.conf" for easy setup and usage. The help document for the script is shown:
pktgen-nst.sh <[-h | --help] |
               [-i | --module-info] |
               [-k | --kernel-thread-status] |
               [-n | --nic-status [network interface]] |
               [[-v | --verbose] -l | --load-pktgen] |
               [[-v | --verbose] -u | --unload-pktgen] |
               [[-v | --verbose] -r | --reset-pktgen] |
               [[-v | --verbose] -c | --conf <pktgen-nst.conf>]>
The pktgen network packet generator is used in this article to help measure maximum Gigabit Ethernet frame rates.
iperf
iperf is a tool to measure maximum TCP bandwidth performance, allowing the tuning of various parameters and UDP characteristics. iperf reports bandwidth, delay jitter and datagram loss. iperf runs as either a client or server with all options configured on the command line. The help document for iperf is shown:
Usage: iperf [-s|-c host] [options]
       iperf [-h|--help] [-v|--version]

Client/Server:
  -f, --format    [kmKM]   format to report: Kbits, Mbits, KBytes, MBytes
  -i, --interval  #        seconds between periodic bandwidth reports
  -l, --len       #[KM]    length of buffer to read or write (default 8 KB)
  -m, --print_mss          print TCP maximum segment size (MTU - TCP/IP header)
  -o, --output    <filename> output the report or error message to this specified file
  -p, --port      #        server port to listen on/connect to
  -u, --udp                use UDP rather than TCP
  -w, --window    #[KM]    TCP window size (socket buffer size)
  -B, --bind      <host>   bind to <host>, an interface or multicast address
  -C, --compatibility      for use with older versions does not sent extra msgs
  -M, --mss       #        set TCP maximum segment size (MTU - 40 bytes)
  -N, --nodelay            set TCP no delay, disabling Nagle's Algorithm
  -V, --IPv6Version        Set the domain to IPv6

Server specific:
  -s, --server             run in server mode
  -U, --single_udp         run in single threaded UDP mode
  -D, --daemon             run the server as a daemon

Client specific:
  -b, --bandwidth #[KM]    for UDP, bandwidth to send at in bits/sec
                           (default 1 Mbit/sec, implies -u)
  -c, --client    <host>   run in client mode, connecting to <host>
  -d, --dualtest           Do a bidirectional test simultaneously
  -n, --num       #[KM]    number of bytes to transmit (instead of -t)
  -r, --tradeoff           Do a bidirectional test individually
  -t, --time      #        time in seconds to transmit for (default 10 secs)
  -F, --fileinput <name>   input the data to be transmitted from a file
  -I, --stdin              input the data to be transmitted from stdin
  -L, --listenport #       port to receive bidirectional tests back on
  -P, --parallel  #        number of parallel client threads to run
  -T, --ttl       #        time-to-live, for multicast (default 1)
  -Z, --linux-congestion <algo>  set TCP congestion control algorithm (Linux only)

Miscellaneous:
  -x, --reportexclude [CDMSV]   exclude C(connection) D(data) M(multicast) S(settings) V(server) reports
  -y, --reportstyle C      report as a Comma-Separated Values
  -h, --help               print this message and quit
  -v, --version            print version information and quit

[KM] Indicates options that support a K or M suffix for kilo- or mega-

The TCP window size option can be set by the environment variable
TCP_WINDOW_SIZE. Most other options can be set by an environment variable
IPERF_<long option name>, such as IPERF_BANDWIDTH.

Report bugs to <iperf-users@lists.sourceforge.net>
The iperf network packet generator is used in this article help measure maximum Gigabit Ethernet data rates.
trafgen
trafgen is a zero-copy high performance network packet traffic generator utility that is part of the netsniff-ng networking toolkit. trafgen requires a packet configuration file which defines the characteristic of the network protocol packets to generate. NST bundles two (2) configuration files for UDP packet generation with trafgen. One configuration file is for a minimum UDP payload of 18 bytes (/etc/netsniff-ng/trafgen/nst_udp_pkt_18.txf) which produces a minimum UDP packet of "60 Bytes". The other configuration file is for a maximum UDP payload of 1472 bytes (/etc/netsniff-ng/trafgen/nst_udp_pkt_1472.txf) which produces a maximum UDP packet of "1514 Bytes". The help document for trafgen is shown:
trafgen 0.5.6.0, network packet generator
http://www.netsniff-ng.org

Usage: trafgen [options]
Options:
  -d|--dev <netdev>      Networking Device
  -c|--conf <file>       Packet configuration txf-file
  -J|--jumbo-support     Support for 64KB Super Jumbo Frames
                         Default: up to 1500Bytes
  -n|--num <uint>        Number of packets until exit
  `--     0              Loop until interrupt (default)
   `-     n              Send n packets and done
  -t|--gap <int>         Interpacket gap in us (approx)
  -k|--kernel-pull <int> Kernel pull from user interval in us
                         Default is 10us where the TX_RING
                         is populated with payload from uspace
  -r|--rand              Randomize packet selection process
                         Instead of a round robin selection
  -S|--ring-size <size>  Manually set ring size to <size>:
                         mmap space in KB/MB/GB, e.g. '10MB'
  -H|--prio-high         Make this high priorize process
  -Q|--notouch-irq       Do not touch IRQ CPU affinity of NIC
  -b|--bind-cpu <cpu>    Bind to specific CPU or CPU-range
  -B|--unbind-cpu <cpu>  Forbid to use specific CPU or CPU-range
  -v|--version           Print version
  -h|--help              Print this help

Examples:
  See trafgen.txf for configuration file examples.
  trafgen --dev eth0 --conf trafgen.txf --bind 0
  trafgen --dev eth0 --conf trafgen.txf --rand --gap 1000
  trafgen --dev eth0 --conf trafgen.txf --bind 0 --num 10 --rand

Note:
  This tool is targeted for network developers! You should
  be aware of what you are doing and what these options above
  mean! Only use this tool in an isolated LAN that you own!

Please report bugs to <bugs@netsniff-ng.org>
Copyright (C) 2011 Daniel Borkmann <dborkma@tik.ee.ethz.ch>,
Swiss federal institute of technology (ETH Zurich)
License: GNU GPL version 2
This is free software: you are free to change and redistribute it.
There is NO WARRANTY, to the extent permitted by law.
The trafgen network packet generator is used in this article to help measure both maximum Gigabit Ethernet data rates and maximum Gigabit Ethernet frame rates.
packETH
packETH is a Linux GUI packet generator tool for ethernet. The tool was used to help construct the UDP packet configuration files for the trafgen packet generator.
Packet Capture Tools
netsniff-ng
netsniff-ng is a zero-copy high performance Linux based network protocol analyzer that is part of the netsniff-ng networking toolkit. The zero-copy mechanism prevents the copy of network packets from Kernel space to User space and vice versa. netsniff-ng supports the pcap file format for capturing, replaying or performing offline-analysis of pcap file dumps. Gigabit Ethernet wire speed packet capture can be accomplished with this tool at maximum data rates and is demonstrated in this article. The help document for netsniff-ng is shown:
netsniff-ng 0.5.6.0, the packet sniffing beast
http://www.netsniff-ng.org

Usage: netsniff-ng [options]
Options:
  -i|-d|--dev|--in <dev|pcap>  Input source as netdev or pcap
  -o|--out <dev|pcap>          Output sink as netdev or pcap
  -r|--randomize               Randomize packet forwarding order
  -f|--filter <bpf-file>       Use BPF filter rule from file
  -J|--jumbo-support           Support for 64KB Super Jumbo Frames
                               Default: up to 1500Bytes
  -n|--num <uint>              Number of packets until exit
  `--     0                    Loop until interrupt (default)
   `-     n                    Send n packets and done
  -M|--no-promisc              No promiscuous mode for netdev
  -t|--type <type>             Only handle packets of defined type:
                               host|broadcast|multicast|others|outgoing
  -m|--mmap                    Mmap pcap file, otherwise use scatter/gather I/O
  -c|--clrw                    Instead scatter/gather I/O use read/write I/O
  -S|--ring-size <size>        Manually set ring size to <size>:
                               mmap space in KB/MB/GB, e.g. '10MB'
  -k|--kernel-pull <int>       Kernel pull from user interval in us
                               Default is 10us where the TX_RING
                               is populated with payload from uspace
  -b|--bind-cpu <cpu>          Bind to specific CPU or CPU-range
  -B|--unbind-cpu <cpu>        Forbid to use specific CPU or CPU-range
  -H|--prio-high               Make this high priorize process
  -Q|--notouch-irq             Do not touch IRQ CPU affinity of NIC
  -s|--silent                  Do not print captured packets
  -q|--less                    Print less-verbose packet information
  -l|--payload                 Only print human-readable payload
  -x|--payload-hex             Only print payload in hex format
  -C|--c-style                 Print full packet in trafgen/C style hex format
  -X|--all-hex                 Print packets in hex format
  -N|--no-payload              Only print packet header
  -v|--version                 Show version
  -h|--help                    Show this help

Examples:
  netsniff-ng --in eth0 --out dump.pcap --silent --bind-cpu 0
  netsniff-ng --in dump.pcap --mmap --out eth0 --silent --bind-cpu 0
  netsniff-ng --in any --filter icmp.bpf --all-hex
  netsniff-ng --in eth0 --out eth1 --silent --bind-cpu 0 \
              --type host --filter /etc/netsniff-ng/rules/http.bpf

Note:
  This tool is targeted for network developers! You should
  be aware of what you are doing and what these options above
  mean! Use netsniff-ng's bpfc compiler for generating filter files.

Please report bugs to <bugs@netsniff-ng.org>
Copyright (C) 2009-2011 Daniel Borkmann <daniel@netsniff-ng.org>
Copyright (C) 2009-2011 Emmanuel Roullit <emmanuel@netsniff-ng.org>
License: GNU GPL version 2
This is free software: you are free to change and redistribute it.
There is NO WARRANTY, to the extent permitted by law.
The netsniff-ng packet capture protocol ananlyzer is used in this article to help measure both maximum Gigabit Ethernet data rates and maximum Gigabit Ethernet frame rates.
Network Monitors
NST Network Interface Bandwidth Monitor
The NST Network Interface Bandwidth Monitor is an interactive dynamic SVG/AJAX enabled application integrated into the NST WUI for monitoring Network Bandwidth usage on each configured network interface in pseudo real-time. This monitor reads network interface data derived from the Kernel Proc file: "/proc/net/dev". The displayed graph and computed bandwidth data rates are extremely accurate due to minimum received packet loss since data is read from Kernel space.
The Bandwidth Monitor Ruler Measurement tool is used extensively for pinpoint data rate calculations, time duration measurements and for packet counts and rates.
Maximum Gigabit Ethernet Data Rate Measurement
trafgen: UDP 1514 Byte Packets
In this section we will demonstrate the use of the trafgen packet generator tool to produce a Gigabit Ethernet UDP stream of packets at the maximum possible data rate of "117 MiB/s". trafgen is run on the emachine NST probe using network interface: "p32p1" and the receiving NST probe shopper2 is capturing the UDP stream with netsniff-ng on network interface: "p1p1". The caption below shows the results of running the trafgen command using the NST provided configuration file containing a UDP packet payload of 1472 bytes (i.e., All ASCII character "A"s (Hex 0x41)). In this demonstration 1,000,000 packets are generated.
trafgen 0.5.6.0
CFG:
n 1000000, gap 0 us, pkts 1
[0] pkt
 len 1514 cnts 0 rnds 0
 payload ff ff ff ff ff ff fe 00 00 00 00 00 08 00 45 00 05 ce 12 34 40 00 ff 11 d9 d0 c0 a8 04 64 c0 a8 04 65 07 d0 07 d1 05 ba
87 ec 41 41 41 41 41 41 41 41 41 41 41 41 41 41 41 41 41 41 41 41 41 41 41 41 41 41 41 41 41 41 41 41 41 41 41 41 41 41 41 41 41
41 41 41 41 41 41 41 41 41 41 41 41 41 41 41 41 41 41 41 41 41 41 41 41 41 41 41 41 41 41 41 41 41 41 41 41 41 41 41 41 41 41 41
41 41 41 41 41 41 41 41 41 41 41 41 41 41 41 41 41 41 41 41 41 41 41 41 41 41 41 41 41 41 41 41 41 41 41 41 41 41 41 41 41 41 41
41 41 41 41 41 41 41 41 41 41 41 41 41 41 41 41 41 41 41 41 41 41 41 41 41 41 41 41 41 41 41 41 41 41 41 41 41 41 41 41 41 41 41
41 41 41 41 41 41 41 41 41 41 41 41 41 41 41 41 41 41 41 41 41 41 41 41 41 41 41 41 41 41 41 41 41 41 41 41 41 41 41 41 41 41 41
41 41 41 41 41 41 41 41 41 41 41 41 41 41 41 41 41 41 41 41 41 41 41 41 41 41 41 41 41 41 41 41 41 41 41 41 41 41 41 41 41 41 41
41 41 41 41 41 41 41 41 41 41 41 41 41 41 41 41 41 41 41 41 41 41 41 41 41 41 41 41 41 41 41 41 41 41 41 41 41 41 41 41 41 41 41
41 41 41 41 41 41 41 41 41 41 41 41 41 41 41 41 41 41 41 41 41 41 41 41 41 41 41 41 41 41 41 41 41 41 41 41 41 41 41 41 41 41 41
41 41 41 41 41 41 41 41 41 41 41 41 41 41 41 41 41 41 41 41 41 41 41 41 41 41 41 41 41 41 41 41 41 41 41 41 41 41 41 41 41 41 41
41 41 41 41 41 41 41 41 41 41 41 41 41 41 41 41 41 41 41 41 41 41 41 41 41 41 41 41 41 41 41 41 41 41 41 41 41 41 41 41 41 41 41
41 41 41 41 41 41 41 41 41 41 41 41 41 41 41 41 41 41 41 41 41 41 41 41 41 41 41 41 41 41 41 41 41 41 41 41 41 41 41 41 41 41 41
41 41 41 41 41 41 41 41 41 41 41 41 41 41 41 41 41 41 41 41 41 41 41 41 41 41 41 41 41 41 41 41 41 41 41 41 41 41 41 41 41 41 41
41 41 41 41 41 41 41 41 41 41 41 41 41 41 41 41 41 41 41 41 41 41 41 41 41 41 41 41 41 41 41 41 41 41 41 41 41 41 41 41 41 41 41
41 41 41 41 41 41 41 41 41 41 41 41 41 41 41 41 41 41 41 41 41 41 41 41 41 41 41 41 41 41 41 41 41 41 41 41 41 41 41 41 41 41 41
41 41 41 41 41 41 41 41 41 41 41 41 41 41 41 41 41 41 41 41 41 41 41 41 41 41 41 41 41 41 41 41 41 41 41 41 41 41 41 41 41 41 41
41 41 41 41 41 41 41 41 41 41 41 41 41 41 41 41 41 41 41 41 41 41 41 41 41 41 41 41 41 41 41 41 41 41 41 41 41 41 41 41 41 41 41
41 41 41 41 41 41 41 41 41 41 41 41 41 41 41 41 41 41 41 41 41 41 41 41 41 41 41 41 41 41 41 41 41 41 41 41 41 41 41 41 41 41 41
41 41 41 41 41 41 41 41 41 41 41 41 41 41 41 41 41 41 41 41 41 41 41 41 41 41 41 41 41 41 41 41 41 41 41 41 41 41 41 41 41 41 41
41 41 41 41 41 41 41 41 41 41 41 41 41 41 41 41 41 41 41 41 41 41 41 41 41 41 41 41 41 41 41 41 41 41 41 41 41 41 41 41 41 41 41
41 41 41 41 41 41 41 41 41 41 41 41 41 41 41 41 41 41 41 41 41 41 41 41 41 41 41 41 41 41 41 41 41 41 41 41 41 41 41 41 41 41 41
41 41 41 41 41 41 41 41 41 41 41 41 41 41 41 41 41 41 41 41 41 41 41 41 41 41 41 41 41 41 41 41 41 41 41 41 41 41 41 41 41 41 41
41 41 41 41 41 41 41 41 41 41 41 41 41 41 41 41 41 41 41 41 41 41 41 41 41 41 41 41 41 41 41 41 41 41 41 41 41 41 41 41 41 41 41
41 41 41 41 41 41 41 41 41 41 41 41 41 41 41 41 41 41 41 41 41 41 41 41 41 41 41 41 41 41 41 41 41 41 41 41 41 41 41 41 41 41 41
41 41 41 41 41 41 41 41 41 41 41 41 41 41 41 41 41 41 41 41 41 41 41 41 41 41 41 41 41 41 41 41 41 41 41 41 41 41 41 41 41 41 41
41 41 41 41 41 41 41 41 41 41 41 41 41 41 41 41 41 41 41 41 41 41 41 41 41 41 41 41 41 41 41 41 41 41 41 41 41 41 41 41 41 41 41
41 41 41 41 41 41 41 41 41 41 41 41 41 41 41 41 41 41 41 41 41 41 41 41 41 41 41 41 41 41 41 41 41 41 41 41 41 41 41 41 41 41 41
41 41 41 41 41 41 41 41 41 41 41 41 41 41 41 41 41 41 41 41 41 41 41 41 41 41 41 41 41 41 41 41 41 41 41 41 41 41 41 41 41 41 41
41 41 41 41 41 41 41 41 41 41 41 41 41 41 41 41 41 41 41 41 41 41 41 41 41 41 41 41 41 41 41 41 41 41 41 41 41 41 41 41 41 41 41
41 41 41 41 41 41 41 41 41 41 41 41 41 41 41 41 41 41 41 41 41 41 41 41 41 41 41 41 41 41 41 41 41 41 41 41 41 41 41 41 41 41 41
41 41 41 41 41 41 41 41 41 41 41 41 41 41 41 41 41 41 41 41 41 41 41 41 41 41 41 41 41 41 41 41 41 41 41 41 41 41 41 41 41 41 41
41 41 41 41 41 41 41 41 41 41 41 41 41 41 41 41 41 41 41 41 41 41 41 41 41 41 41 41 41 41 41 41 41 41 41 41 41 41 41 41 41 41 41
41 41 41 41 41 41 41 41 41 41 41 41 41 41 41 41 41 41 41 41 41 41 41 41 41 41 41 41 41 41 41 41 41 41 41 41 41 41 41 41 41 41 41
41 41 41 41 41 41 41 41 41 41 41 41 41 41 41 41 41 41 41 41 41 41 41 41 41 41 41 41 41 41 41 41 41 41 41 41 41 41 41 41 41 41 41
41 41 41 41 41 41 41 41 41 41 41 41 41 41 41 41 41 41 41 41 41 41 41 41 41 41 41 41 41 41 41 41 41 41 41 41 41 41 41 41 41 41 41
41 41 41 41 41 41 41 41 41 41 41 41
TX: 238.38 MB, 3814 Frames each 65536 Byte allocated
MD: FIRE RR 10us

Running! Hang up with ^C!

1000000 frames outgoing
1514000000 bytes outgoing
[root@emachine tmp]#
[root@probe ~]#
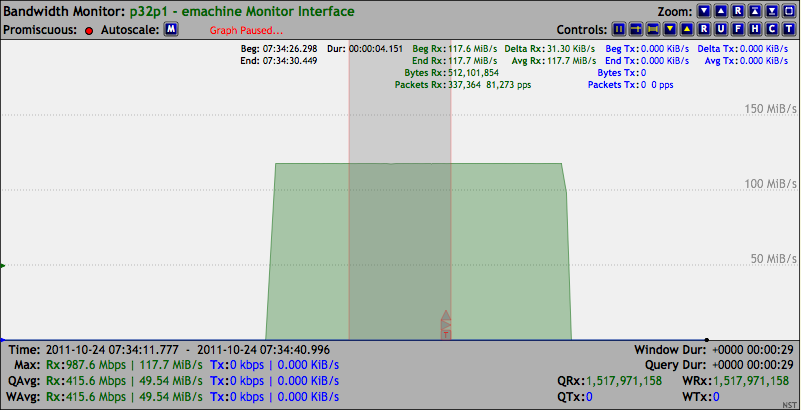
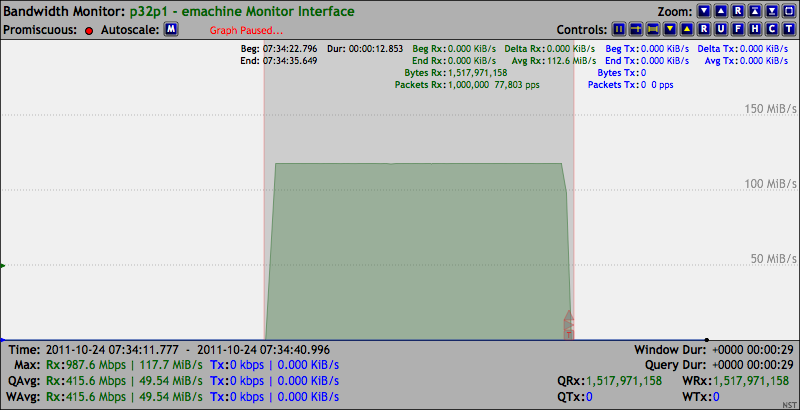
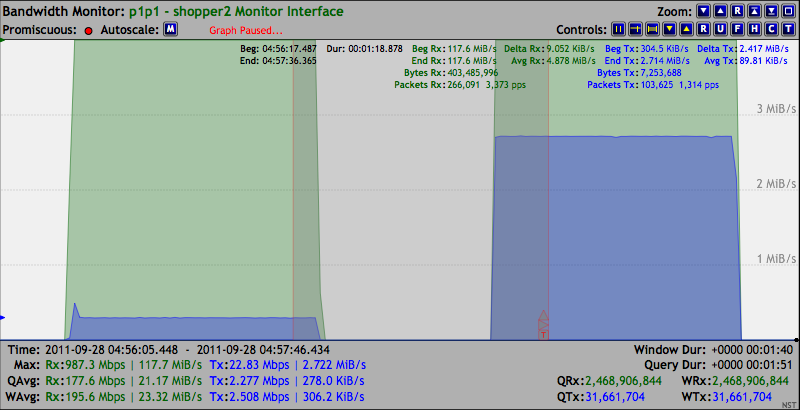
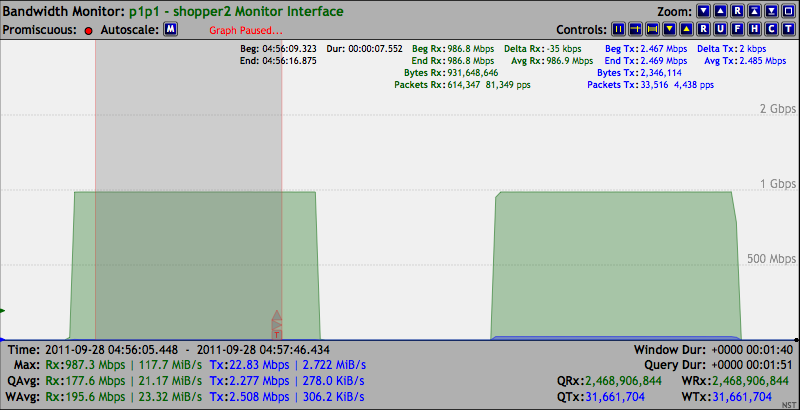
On the receiving shopper2 system we can observe from the results of the Bandwidth Monitor application below that the maximum Gigabit Ethernet data rate of "117.7 MiB/s (81,273 pps)" was sustained for the duration of sending out 1,000,000 UDP packets. In this case, the NST WUI was rendered on a browser in the management network from running the Bandwidth Monitor application on shopper2. The Bandwidth Monitor was configured for a data query period of 200 msec.
The Bandwidth Monitor Ruler Measurement tool was opened up to span across the entire packet generation session which took "12.736 seconds" in duration and revealed that exactly 1,000,000 packets were received.
The netsniff-ng protocol analyzer shown below captured exactly 1,000,000 packets on network interface: "p1p1" and store the results in pcap format to file: "/dev/shm/c1.pcap".
The capture file size was: "1,530,000,024 Bytes".
netsniff-ng 0.5.6.0
RX: 238.41 MB, 122064 Frames each 2048 Byte allocated
OUI UDP TCP ETH
PROMISC
BPF:
(000) ret      #-1
MD: RX SCATTER/GATHER

B 5 1514 1317192007.975538
B 5 1514 1317192007.975550
B 5 1514 1317192007.975556
.
.
.
B 5 1514 1317192020.280075
B 5 1514 1317192020.280076
B 5 1514 1317192020.280077
1000000 frames incoming
1000000 frames passed filter
  0 frames failed filter (out of space)
[root@shopper2 shm]#
/dev/shm
[root@shopper2 shm]#
total 1497072
drwxrwxrwt  2 root root         60 Sep 26 06:19 .
drwxr-xr-x 22 root root       4100 Sep 26 05:55 ..
-rw-------  1 root root 1530000024 Sep 28 02:40 c1.pcap
[root@shopper2 shm]#
File name:           ./c1.pcap
File type:           Wireshark/tcpdump/... - libpcap
File encapsulation:  Ethernet
Packet size limit:   file hdr: 65535 bytes
Number of packets:   1000000
File size:           1530000024 bytes
Data size:           1514000000 bytes
Capture duration:    12 seconds
Start time:          Wed Sep 28 02:40:07 2011
End time:            Wed Sep 28 02:40:20 2011
Data byte rate:      123044025.00 bytes/sec
Data bit rate:       984352199.97 bits/sec
Average packet size: 1514.00 bytes
Average packet rate: 81270.82 packets/sec
SHA1:                2107c313d8ac4634fd4552f3809c15c7f4d4550d
RIPEMD160:           8358815a4a5db76a1a862a1375bc413a21b4fe16
MD5:                 e8f6ae140d2905f9b313e114951158b7
Strict time order:   True
[root@shopper2 shm]#
As a validity check on the integrity of the netsniff-ng generated pcap file, the capinfo utility was used. The data and packet rate calculation results from the capinfos utility above also validates the results from the NST Network Interface Bandwidth Monitor application.
iperf: TCP/IP 1514 Byte Packets
In this section we will demonstrate the use of the iperf packet generator tool to produce a Gigabit Ethernet TCP/IP stream of packets at the maximum possible data rate of "117 MiB/s". The iperf server side was first run on the shopper2 NST probe which is depicted below.
------------------------------------------------------------
Server listening on TCP port 5001
TCP window size: 85.3 KByte (default)
------------------------------------------------------------
[  4] local 192.168.4.101 port 5001 connected with 192.168.4.100 port 42002
[ ID] Interval       Transfer     Bandwidth
[  4]  0.0-10.0 sec  1.10 GBytes   941 Mbits/sec
On the emachine, the iperf client side, iperf is run for is default duration of 10 seconds. The results of "942 Mbit/sec" agrees with the theoretical maximum Gigabit Ethernet using TCP/IP packets of "117,685,306 Bytes/sec (941.482448 Mbit/sec)".
------------------------------------------------------------
Client connecting to 192.168.4.101, TCP port 5001
TCP window size: 16.0 KByte (default)
------------------------------------------------------------
[  3] local 192.168.4.100 port 42002 connected with 192.168.4.101 port 5001
[ ID] Interval       Transfer     Bandwidth
[  3]  0.0-10.0 sec  1.10 GBytes   942 Mbits/sec
[root@emachine tmp]#
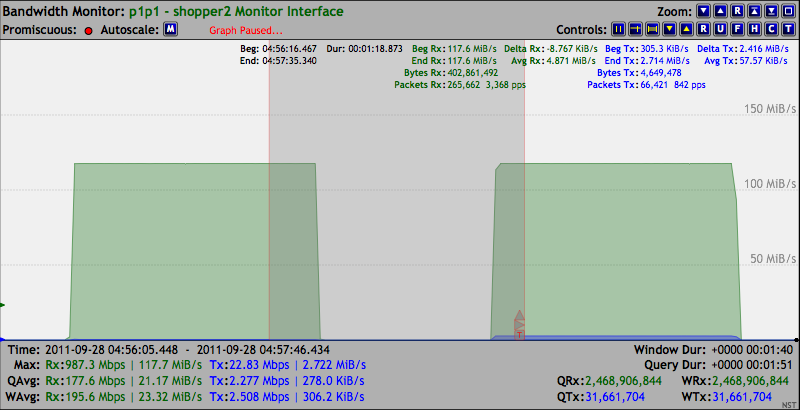
The Bandwidth Monitoring graph (i.e., Highlighted by the left edge of the Ruler Measurement tool) below is the results from this iperf run. The maximum bandwidth data rate of "117.7 MiB/s" was achieved.
By default, the Linux Receiver Segmentation Offloading was on (i.e., generic-receive-offload: on) as shown below from the output of the "ethtool -k" utility. The effect of this feature is to produce "Super Jumbo Frames" for supported NIC hardware during high data bandwidth rates. These frames are then presented to the Linux network protocol stack. In our case, the Intel Gigabit Ethernet Controller: "82574L" does support Segmentation Offloading and Jumbo Frames.
Offload parameters for p1p1:
rx-checksumming: on
tx-checksumming: on
scatter-gather: on
tcp-segmentation-offload: on
udp-fragmentation-offload: off
generic-segmentation-offload: on
generic-receive-offload: on
large-receive-offload: off
rx-vlan-offload: on
tx-vlan-offload: on
ntuple-filters: off
receive-hashing: off
[root@shopper2 shm]#
netsniff-ng 0.5.6.0
RX: 238.41 MB, 122064 Frames each 2048 Byte allocated
OUI UDP TCP ETH
PROMISC
BPF:
(000) ret      #-1
MD: RX

< 5 74 1317200168.297910
> 5 74 1317200168.297932
< 5 66 1317200168.298025
< 5 90 1317200168.298042
> 5 66 1317200168.298050
< 5 4410 1317200168.298202
< 5 5858 1317200168.298255
< 5 4410 1317200168.298299
> 5 66 1317200168.298316
> 5 66 1317200168.298331
> 5 66 1317200168.298348
< 5 1514 1317200168.298432
> 5 66 1317200168.298446
< 5 5858 1317200168.298487
< 5 1514 1317200168.298494
< 5 4410 1317200168.298533
> 5 66 1317200168.298538
> 5 66 1317200168.298548
> 5 66 1317200168.298560
< 5 5858 1317200168.298585
 21 frames incoming
 21 frames passed filter
  0 frames failed filter (out of space)
[root@shopper2 shm]#
------------------------------------------------------------
Client connecting to 192.168.4.101, TCP port 5001
TCP window size: 16.0 KByte (default)
------------------------------------------------------------
[  3] local 192.168.4.100 port 42002 connected with 192.168.4.101 port 5001
[ ID] Interval       Transfer     Bandwidth
[  3]  0.0-10.0 sec  1.10 GBytes   942 Mbits/sec
[root@emachine tmp]#
------------------------------------------------------------
Server listening on TCP port 5001
TCP window size: 85.3 KByte (default)
------------------------------------------------------------
  5] local 192.168.4.101 port 5001 connected with 192.168.4.100 port 42011
[ ID] Interval       Transfer     Bandwidth
[  5]  0.0-10.0 sec  1.10 GBytes   941 Mbits/sec
Offload parameters for p1p1:
rx-checksumming: on
tx-checksumming: on
scatter-gather: on
tcp-segmentation-offload: on
udp-fragmentation-offload: off
generic-segmentation-offload: on
generic-receive-offload: off
large-receive-offload: off
rx-vlan-offload: on
tx-vlan-offload: on
ntuple-filters: off
receive-hashing: off
[root@shopper2 shm]#
netsniff-ng 0.5.6.0
RX: 238.41 MB, 122064 Frames each 2048 Byte allocated
OUI UDP TCP ETH
PROMISC
BPF:
(000) ret      #-1
MD: RX

< 5 74 1317200253.911661
> 5 74 1317200253.911683
< 5 66 1317200253.911780
< 5 90 1317200253.911798
> 5 66 1317200253.911805
< 5 1514 1317200253.911936
< 5 1514 1317200253.911958
< 5 1514 1317200253.911969
< 5 1514 1317200253.911972
< 5 1514 1317200253.911975
< 5 1514 1317200253.911977
< 5 1514 1317200253.911980
> 5 66 1317200253.911995
> 5 66 1317200253.912001
> 5 66 1317200253.912007
> 5 66 1317200253.912011
> 5 66 1317200253.912015
< 5 1514 1317200253.912019
< 5 1514 1317200253.912021
> 5 66 1317200253.912027
 49 frames incoming
 49 frames passed filter
  0 frames failed filter (out of space)
[root@shopper2 shm]#
Maximum Gigabit Ethernet Frame Rate Measurement
pktgen: UDP 60 Byte Packets
Pause parameters for p32p1:
Autonegotiate:	on
RX:		on
TX:		on
Pause parameters for p1p1:
Autonegotiate:	on
RX:		on
TX:		on
2011-09-29 11:14:26 Using pktgen configuration file: "/usr/share/pktgen/pktgen-nst.conf"
The linux kernel module: "pktgen" is already loaded.
Reset values for all running "pktgen" kernel threads.
Pktgen command: Control: "/proc/net/pktgen/pgctrl"  Cmd: "reset"
Device/pktgen kernel thread affinity mapping: "one-to-one"
Removing all network interface devices from pktgen kernel thread: "kpktgend_0"
Pktgen command: Thread: "/proc/net/pktgen/kpktgend_0"  Cmd: "rem_device_all"
Setting network interface device: "p32p1" to "Up" state.
Adding network interface device: "p32p1" to kernel thread: "kpktgend_0"
Pktgen command: Thread: "/proc/net/pktgen/kpktgend_0"  Cmd: "add_device p32p1"
Pktgen command: Device: "/proc/net/pktgen/p32p1"  Cmd: "clone_skb 1000000"
Pktgen command: Device: "/proc/net/pktgen/p32p1"  Cmd: "count 2000000"
Pktgen command: Device: "/proc/net/pktgen/p32p1"  Cmd: "delay 0"
Pktgen command: Device: "/proc/net/pktgen/p32p1"  Cmd: "pkt_size 60"
Pktgen command: Device: "/proc/net/pktgen/p32p1"  Cmd: "src_mac 00:1B:21:9A:1F:40"
Pktgen command: Device: "/proc/net/pktgen/p32p1"  Cmd: "src_min 192.168.4.255"
Pktgen command: Device: "/proc/net/pktgen/p32p1"  Cmd: "src_max 192.168.4.255"
Pktgen command: Device: "/proc/net/pktgen/p32p1"  Cmd: "udp_src_min 5000"
Pktgen command: Device: "/proc/net/pktgen/p32p1"  Cmd: "udp_src_max 5000"
Pktgen command: Device: "/proc/net/pktgen/p32p1"  Cmd: "dst_mac 00:1b:21:9a:1c:2a"
Pktgen command: Device: "/proc/net/pktgen/p32p1"  Cmd: "dst_min 192.168.4.255"
Pktgen command: Device: "/proc/net/pktgen/p32p1"  Cmd: "dst_max 192.168.4.255"
Pktgen command: Device: "/proc/net/pktgen/p32p1"  Cmd: "udp_dst_min 5001"
Pktgen command: Device: "/proc/net/pktgen/p32p1"  Cmd: "udp_dst_max 5001"

Pktgen '/proc' Directory Listing: "/proc/net/pktgen"
=================================================================================
-rw------- 1 root root 0 Sep 29 11:14 /proc/net/pktgen/kpktgend_0
-rw------- 1 root root 0 Sep 29 11:14 /proc/net/pktgen/kpktgend_1
-rw------- 1 root root 0 Sep 29 11:14 /proc/net/pktgen/p32p1
-rw------- 1 root root 0 Sep 29 11:14 /proc/net/pktgen/pgctrl

Type: 'Ctrl-c' to stop...
***Started: Thu Sep 29 11:14:26 EDT 2011
Pktgen command: Control: "/proc/net/pktgen/pgctrl"  Cmd: "start"
***Stopped: Thu Sep 29 11:14:28 EDT 2011  Duration: +0000 00:00:02

Pktgen - Packet/Data Rate Results:
=================================================================================
Net Interface: p32p1	Rate: 1161871pps 557Mb/sec (557698080bps) errors: 0
			Rate: 69.625MB/sec
			Duration: 1721360usec (1.721secs)
			Bytes Sent: 120000000 (120.000MBytes)
			Packets Sent: 2000000 (2.000MPkts)
---------------------------------------------------------------------------------
Totals:  Packets Sent: 2000000 (2.000MPkts)  Bytes Sent: 120000000 (120.000MBytes)
         Max Packet Rate: 1161871pps 1161.871Kpkts/sec (Duration: 1.721secs)
         Max Bit Rate: 557Mb/sec
         Max Byte Rate: 69.625MB/sec
[root@emachine tmp]#
<div class="userInput"><span class="prompt">[root@emachine tmp]# </span>ethtool -a p32p1</div>
<pre class="computerOutput">
Pause parameters for p32p1:
Autonegotiate:	off
RX:		off
TX:		off
Pause parameters for p1p1:
Autonegotiate:	off
RX:		off
TX:		off
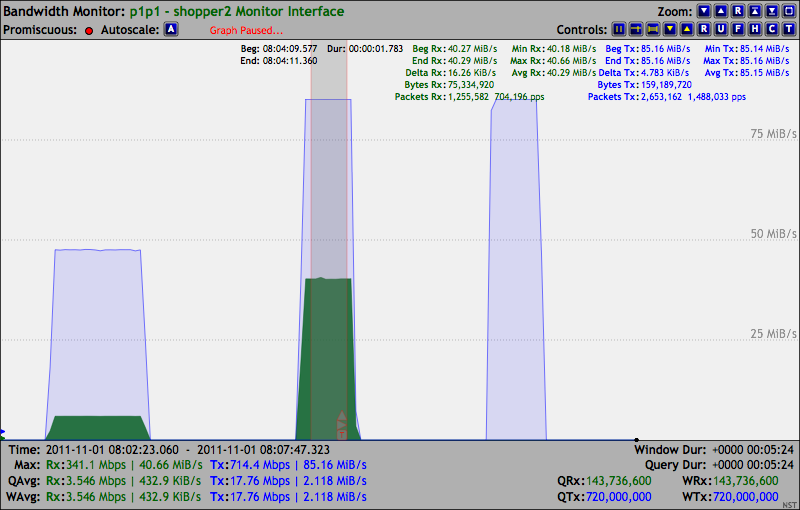
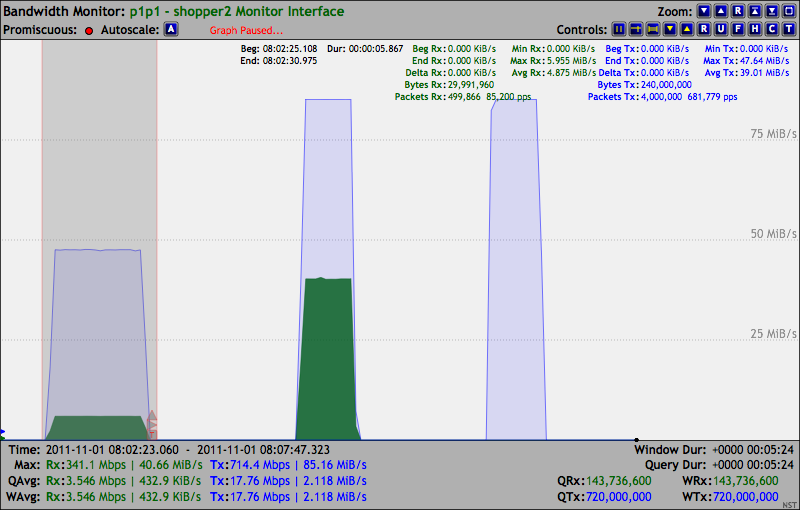
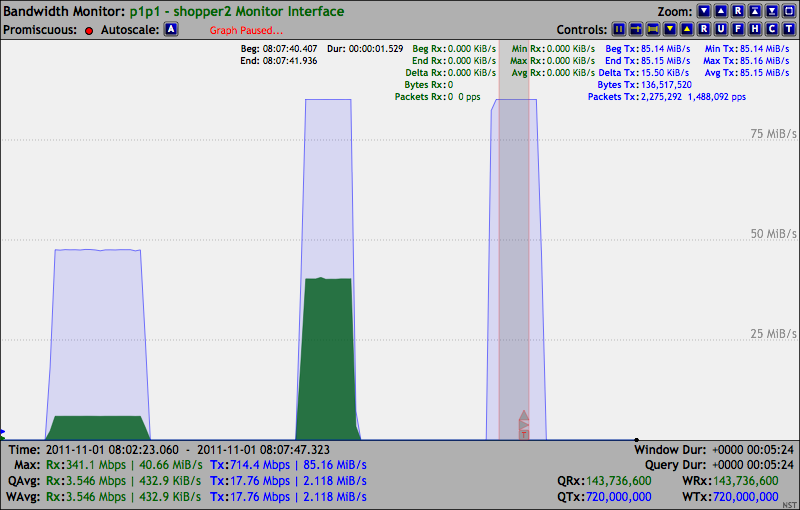
69.95 MiB/s Packets: 2,000,000 1,144,848 pps.
***Note: Ethernet Pause Control Frames sent from the Receiver system are now visible to the Linux Network Protocol stack.
trafgen: UDP 60 Byte Packets
Ethernet Framing - Segmentation & Checksum (CRC) Offloading
Ethernet Flow Control Pause Frame (IEEE 802.3x)
