NST Network Interface Bandwidth Monitor: Difference between revisions
| Line 11: | Line 11: | ||
The following screencast provides a brief introduction to using the Network Interface Bandwidth Monitor: | The following screencast provides a brief introduction to using the Network Interface Bandwidth Monitor: | ||
{{#ev:youtube|eQZ-pIq6C78|640|360}} | {{#ev:youtube|eQZ-pIq6C78|640|360}} | ||
Revision as of 12:43, 2 December 2011
Overview
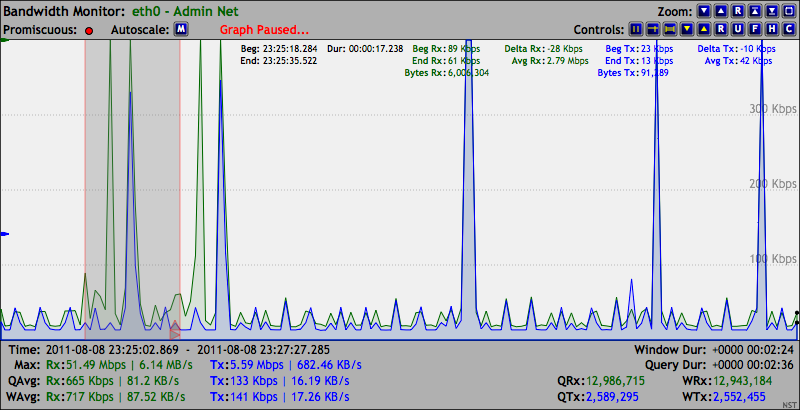
The NST Network Interface Bandwidth Monitor is an interactive dynamic SVG/AJAX enabled application integrated into the NST WUI for monitoring Network Bandwidth usage on each configured network interface in pseudo real-time. The image below is an example display of the bandwidth monitoring application for network interface: "eth0". Also shown is an included Ruler Measurement tool overlay to perform time and bandwidth rate analysis.
A use case for the Bandwidth Monitor can be found in the Wiki article: "LAN Ethernet Maximum RAtes, Generation, Capturing & Monitoring".

SVN: 2502

Screencasts
The following screencast provides a brief introduction to using the Network Interface Bandwidth Monitor:
Feature Summary
The following are key features of the NST Network Interface Bandwidth Monitor tool:
- Graphically monitor Network Bandwidth rates on each configured network interface within the NST WUI.
- User selectable network interface network interface to monitor.
- Interactive display using dynamic SVG (Scalable Vector Graphics).
- User selectable AJAX query updates providing a pseudo real-time Bandwidth Rate presentation.
- Automatic and manual bandwidth rate scale adjustments.
- Pause individual graphs for analysis or synchronization both Received/Transmit graphs when using a TAP for monitoring.
- Adjustable graph dimensions for long duration bandwidth monitoring.
- Customize network interface graph titles.
- Graph controls for visual appearance including fill and opacity setting.
- Zoom controls for graph size enlargement and Full Screen viewing.
- Crosshairs overlay for exploring time and bandwidth values.
- A Ruler Measurement tool overlay for time and bandwidth rate analysis.
NST Bandwidth Monitor Reference Diagram

SVN: 2784
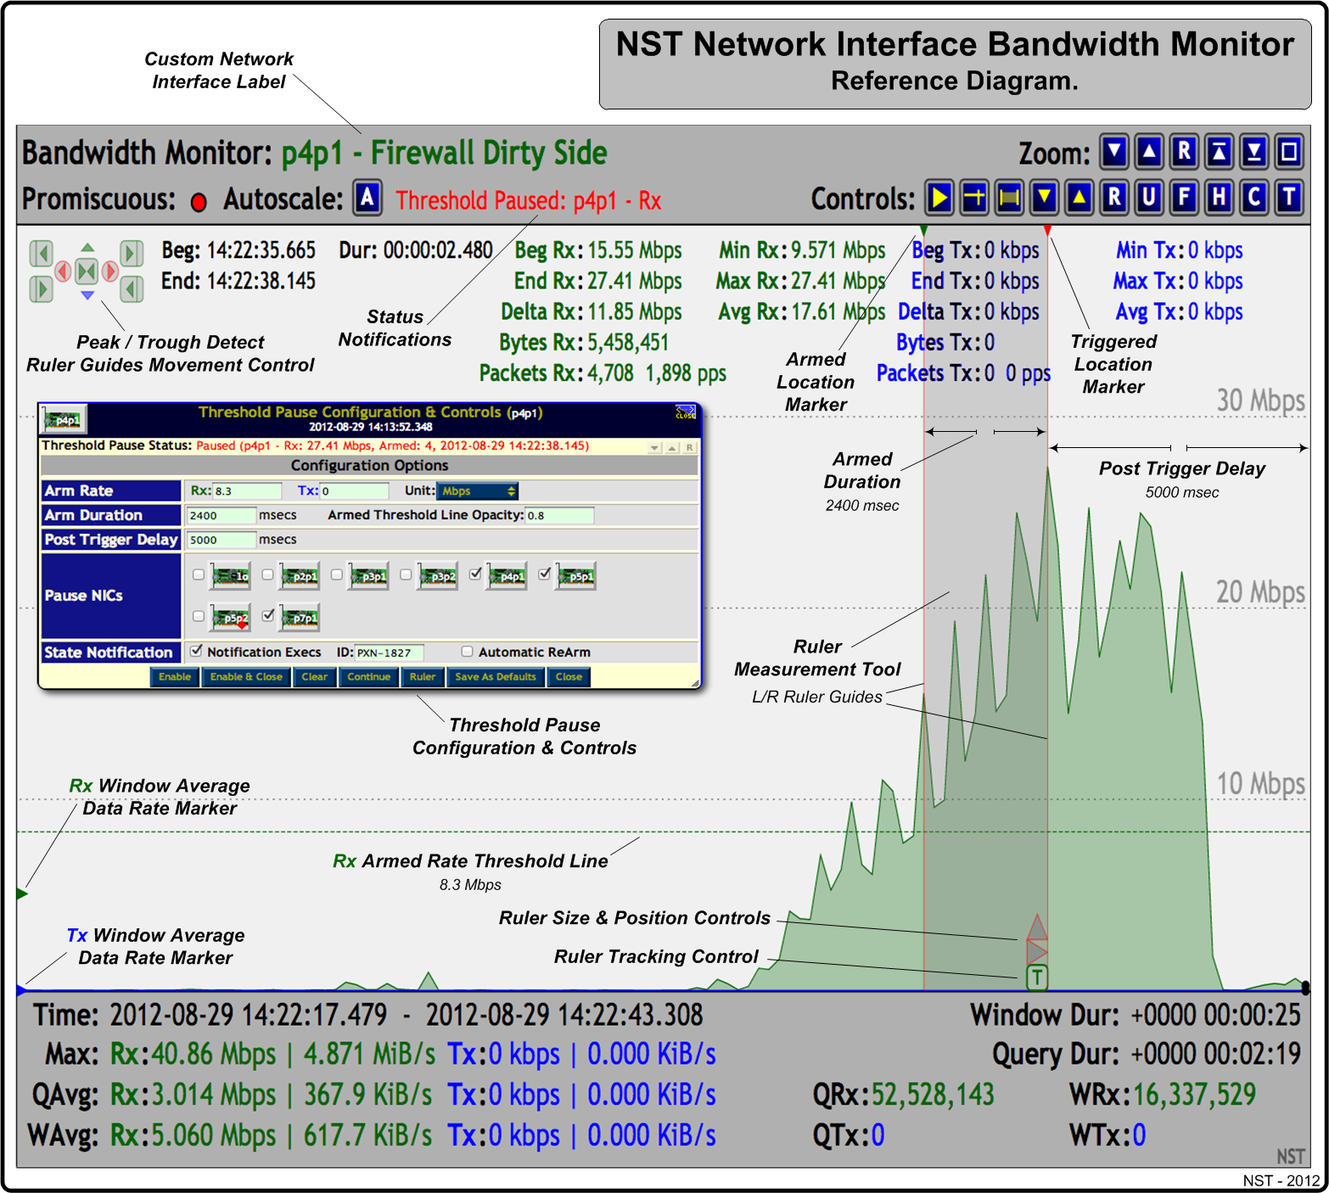
The image below can serve as a reference diagram for the NST Bandwidth Monitor. Many of the Bandwidth Monitor features have been identified and marked on the image. A Threshold Pause feature that allows "Pausing" of one or more Bandwidth Monitoring graphs when a configured Threshold Armed Rate value is Reached or Exceeded (i.e., Triggered) is also shown. Custom executables can also be run each time a Threshold Pause state change occurs. As an example, one could initiate a network packet capture when a sustained bandwidth data rate exceeds a certain level.
The Threshold Pause session was configured on the "p1p1 Bandwidth Monitoring" graph with an Armed Rx bandwidth data rate of: "8.3 Mbps". This bandwidth rate must be maintained for the Armed duration of "2400 msecs" before a Threshold Trigger can occur. A Threshold Trigger event did occur on 2011-11-17 07:59:12.430 at an Rx data rate value of: "14.16 Mbps". A Post Trigger Delay of "5 seconds" was in effect. Two bandwidth monitoring graphs were set to be Paused: p1p1 and em1. A query rate of "200 msec" was also configured for bandwidth monitor graph updates.
All notification executables located in directory: "/etc/nst/notifications/bwmon" were run at each Threshold Pause state change and marked with ID: "GXC-9116".
The traffic generated for this example was from a YUM update. A Dualcomm DGCS-2005L TAP was used on the external side of a firewall and presented the network traffic to interface: "p1p1" .

NST Bandwidth Monitor: Multi-View

SVN: 2784
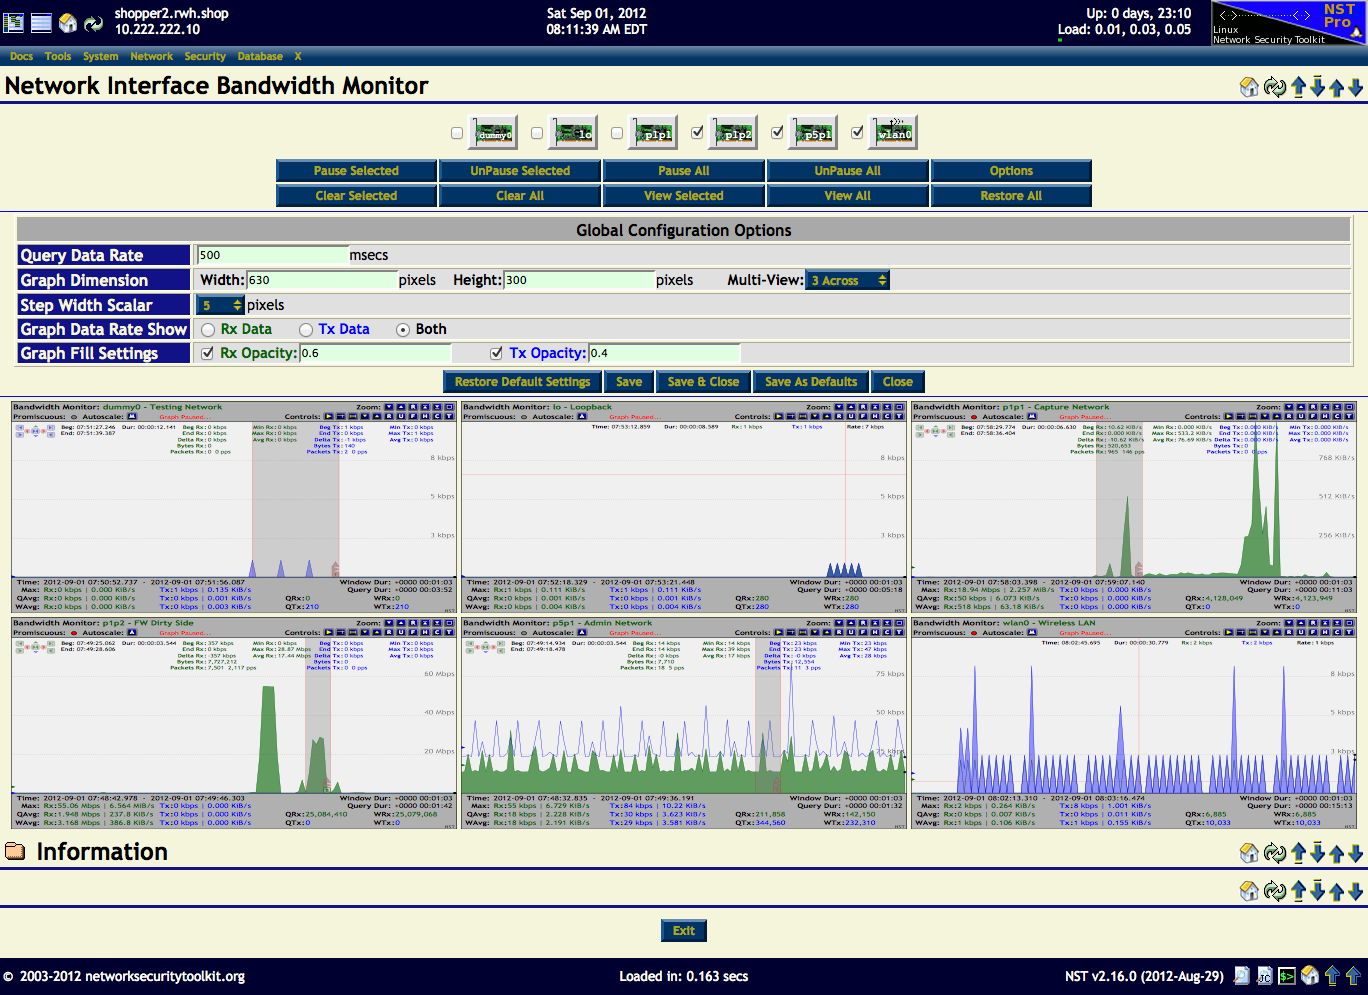
The screenshot below demonstrates the use of the "Multi-View" option for displaying multiple network interfaces in a row. The main purpose of this feature is to present a summary view of all data rate activity occurring on each network interface within the browser viewport without having to scroll. This can be a very handy viewing option for a touch device like an "iPad". One can then zoom in on a particular bandwidth monitoring graph to perform detailed analysis. A 3 Finger Touch Gesture is supported to quickly zoom in on a graph. The zoom scaling capability of each bandwidth monitoring graph is quite remarkable since it is based on SVG. The choices for the "Multi-View" option can be Disabled or a selection range from 1 up to the total number of configured network interfaces on the NST system to be displayed across in a row.
The "Global Configuration Options" panel is also shown below. This is where the "Multi-View" configuration option is located. When you select a new "Multi-View" value your change is immediately presented.

Large Multi-Network Interface Adapter Server Configuration Example
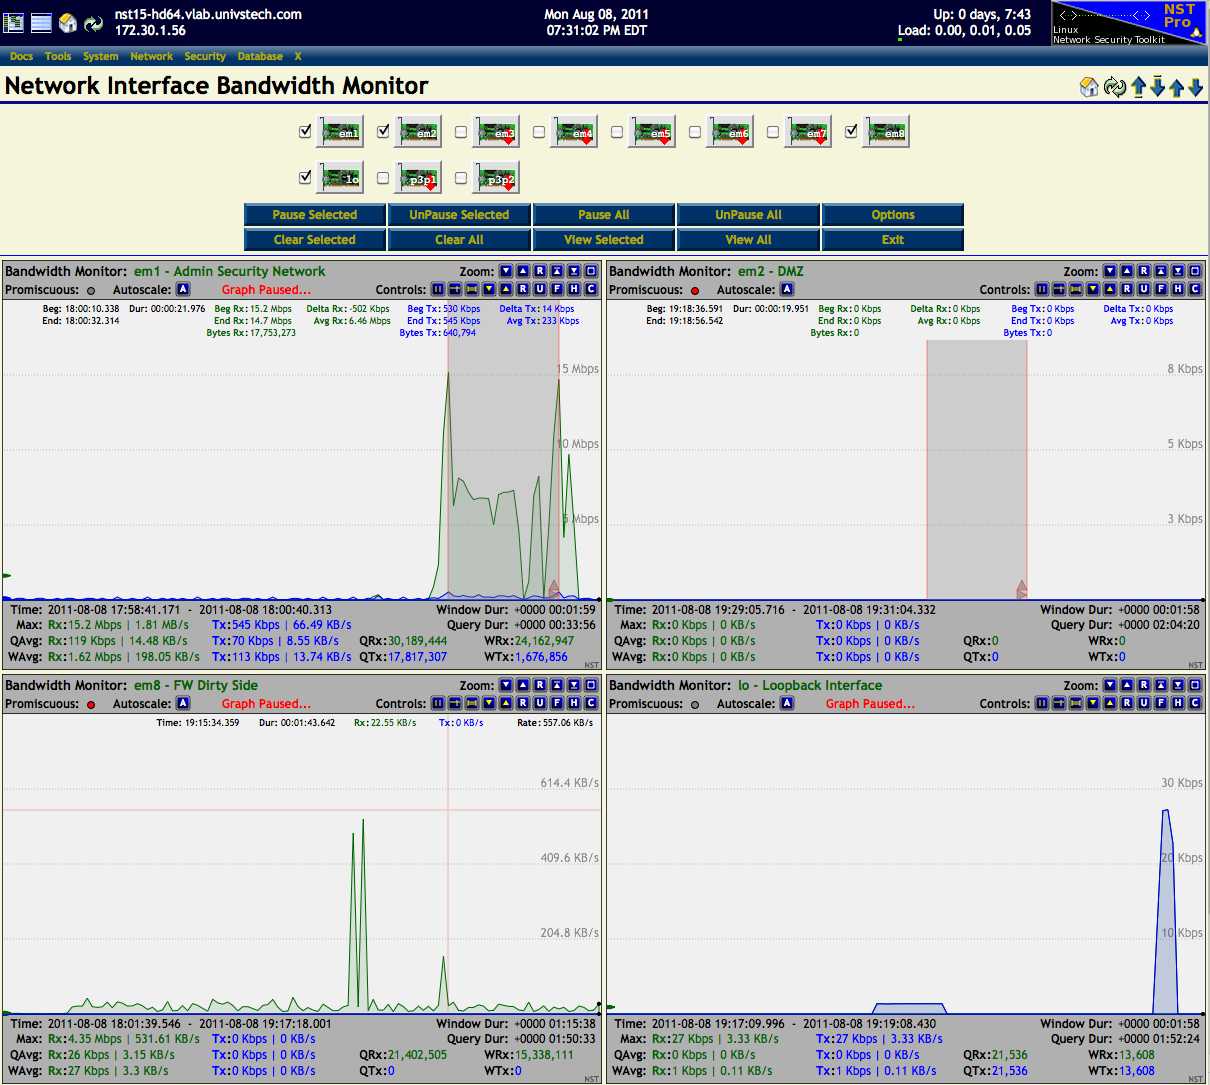
This example shows the bandwidth monitoring application for selected network interfaces: "em1, em2, em8 and lo" on a NST system configured with eleven (11) network interfaces.
