NST Network Interface Bandwidth Monitor: Difference between revisions
| Line 40: | Line 40: | ||
== Large Multi-Network Interface Server Configuration Example == | |||
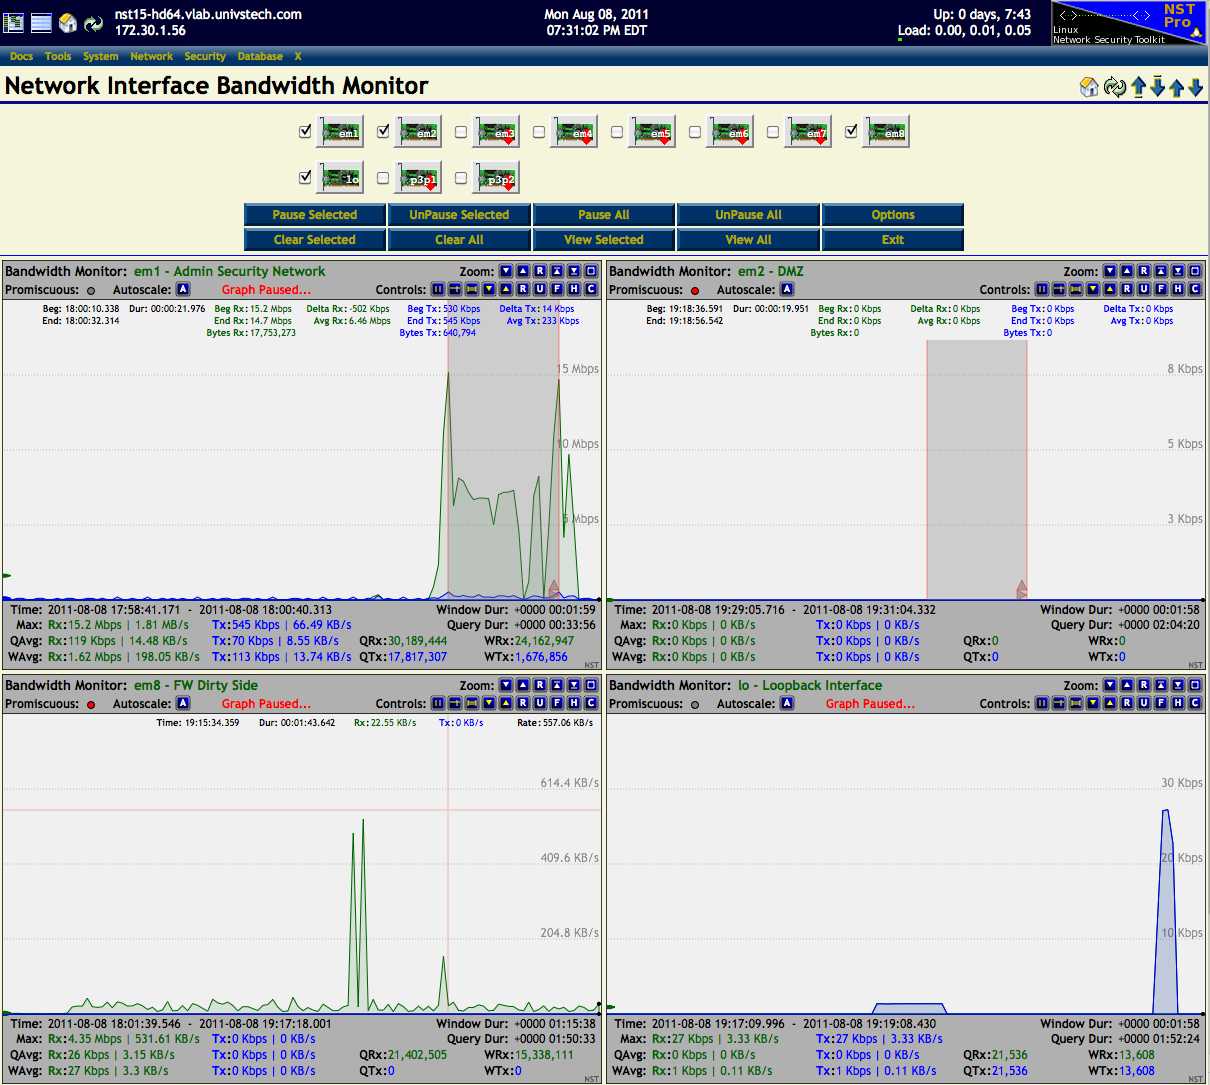
This example shows the bandwidth monitoring application for selected network interfaces: "'''em1, em2, em8''' and '''lo'''" on a NST system configured with eleven (11) network interfaces. | This example shows the bandwidth monitoring application for selected network interfaces: "'''em1, em2, em8''' and '''lo'''" on a NST system configured with eleven (11) network interfaces. | ||
[[Image:Nstbwmon2.png|center|frame|Network Interface Bandwidth Monitor - Selected Multiple Interfaces: em1, em2, em8 and lo]] | [[Image:Nstbwmon2.png|center|frame|Network Interface Bandwidth Monitor - Selected Multiple Interfaces: em1, em2, em8 and lo]] | ||
Revision as of 07:20, 3 September 2011
Overview
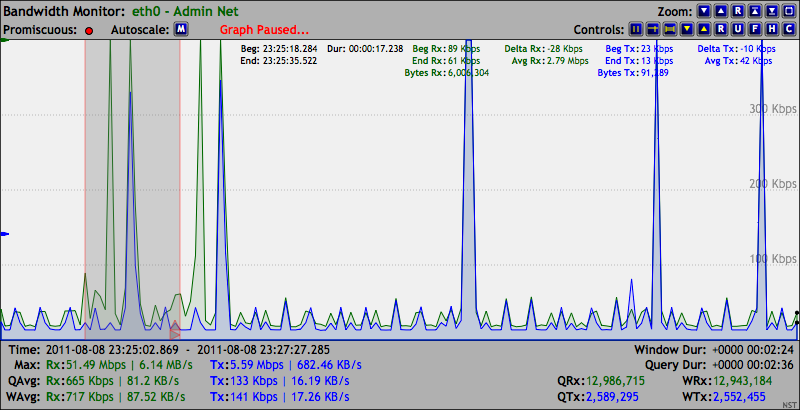
The NST Network Interface Bandwidth Monitor is an interactive dynamic SVG/AJAX enabled application integrated into the NST WUI for monitoring Network Bandwidth usage on each configured network interface in pseudo real-time. The image below is an example display of the bandwidth monitoring application for network interface: "eth0". Also shown is an included Ruler Measurement tool overlay to perform time and bandwidth rate analysis.

SVN: 2502

Screencasts
The following screencast provides a brief introduction to using the Network Interface Bandwidth Monitor:
Feature Summary
The following are key features of the NST Network Interface Bandwidth Monitor tool:
- Graphically monitor Network Bandwidth rates on each configured network interface within the NST WUI.
- User selectable network interface network interface to monitor.
- Interactive display using dynamic SVG (Scalable Vector Graphics).
- User selectable AJAX query updates providing a pseudo real-time Bandwidth Rate presentation.
- Automatic and manual bandwidth rate scale adjustments.
- Pause individual graphs for analysis or synchronization both Received/Transmit graphs when using a TAP for monitoring.
- Adjustable graph dimensions for long duration bandwidth monitoring.
- Customize network interface graph titles.
- Graph controls for visual appearance including fill and opacity setting.
- Zoom controls for graph size enlargement and Full Screen viewing.
- Crosshairs overlay for exploring time and bandwidth values.
- A Ruler Measurement tool overlay for time and bandwidth rate analysis.
Threshold Pause Feature

SVN: 2581
- A Threshold Pause feature that allows "Pausing" of one or more Bandwidth Monitoring graphs when a configured Threshold Pause Rate value is Reached or Exceeded (i.e., Triggered).
The example below shows that a Threshold Pause was configured on the "eth0 Bandwidth Monitoring" graph for an Rx bandwidth data rate of: "50 kbps". The Threshold Pause was Reached on 2011-08-28 14:48:25.106 at an Rx data rate value of: "88 kbps". A Threshold Pause Delay of 5 seconds was in effect. Both the "eth0" and "lo" bandwidth monitoring graphs were Paused.

Large Multi-Network Interface Server Configuration Example
This example shows the bandwidth monitoring application for selected network interfaces: "em1, em2, em8 and lo" on a NST system configured with eleven (11) network interfaces.
