NST Network Interface Bandwidth Monitor 2: Difference between revisions
| Line 52: | Line 52: | ||
== '''Graph Monitor Controls''' == | == '''Graph Monitor Controls''' == | ||
The reference diagram below provides a brief description of each '''Graph Monitor Control''' buttons associated with an '''NST Network Interface Bandwidth Monitor 2 Graph'''. | The reference diagram below provides a brief description of each '''Graph Monitor Control''' buttons associated with an '''NST Network Interface Bandwidth Monitor 2 Graph'''. Browser tool tips are also available for each button and notification area providing a descriptive usage dialog. | ||
[[Image:bwmon2_monctrls_1.png|1024px|center|Network Interface Bandwidth Monitor 2 - Graph Monitor Controls]] | [[Image:bwmon2_monctrls_1.png|1024px|center|Network Interface Bandwidth Monitor 2 - Graph Monitor Controls]] | ||
Revision as of 19:19, 21 November 2013
Overview
The NST Network Interface Bandwidth Monitor 2 is a second generation interactive dynamic SVG/AJAX enabled application integrated into the NST WUI for monitoring Network Bandwidth usage on each configured network interface in pseudo real-time.
A use case for the Bandwidth Monitor can be found in the Wiki article: "LAN Ethernet Maximum RAtes, Generation, Capturing & Monitoring".

SVN: 5413
See page: NST Network Interface Bandwidth Monitor for additional information until this page is completed.
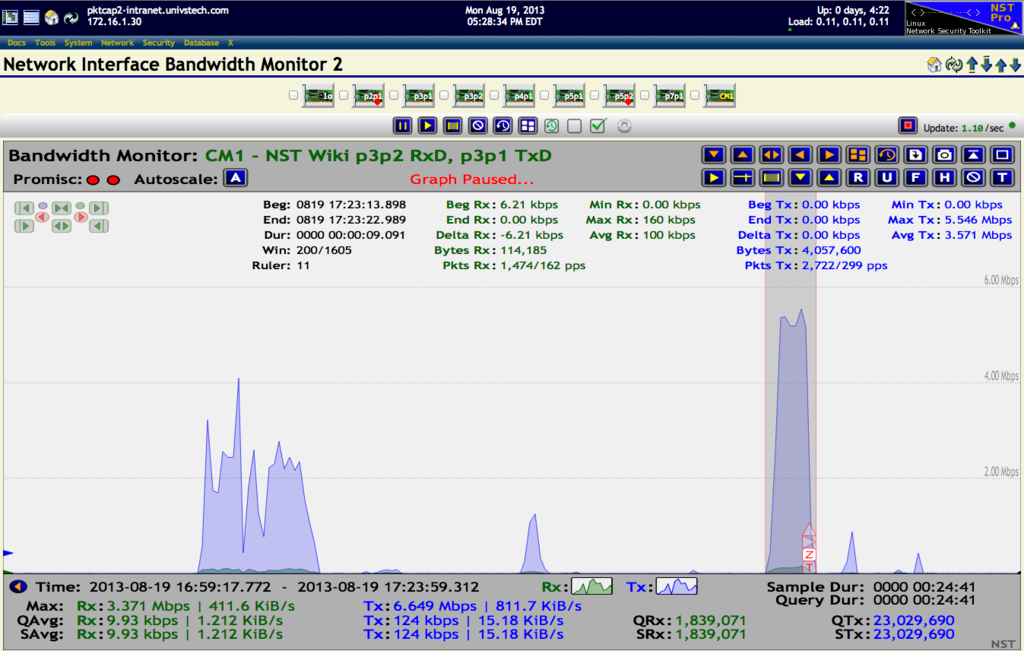
The following Bandwidth Monitor displays network traffic to and from the NST Wiki site. A TP-CU3 Tap is inserted between the NST probe and the NST Wiki site providing full-duplex traffic access. A Custom Monitor was created to display interface traffic on the Tap's two (2) monitoring ports: p3p2 - RxD and p3p1 - TxD. The Ruler Measurement Tool is also enabled and focused on a typical HTTP web page transaction sequence.
NST Bandwidth Monitor 2 - Reference Diagram
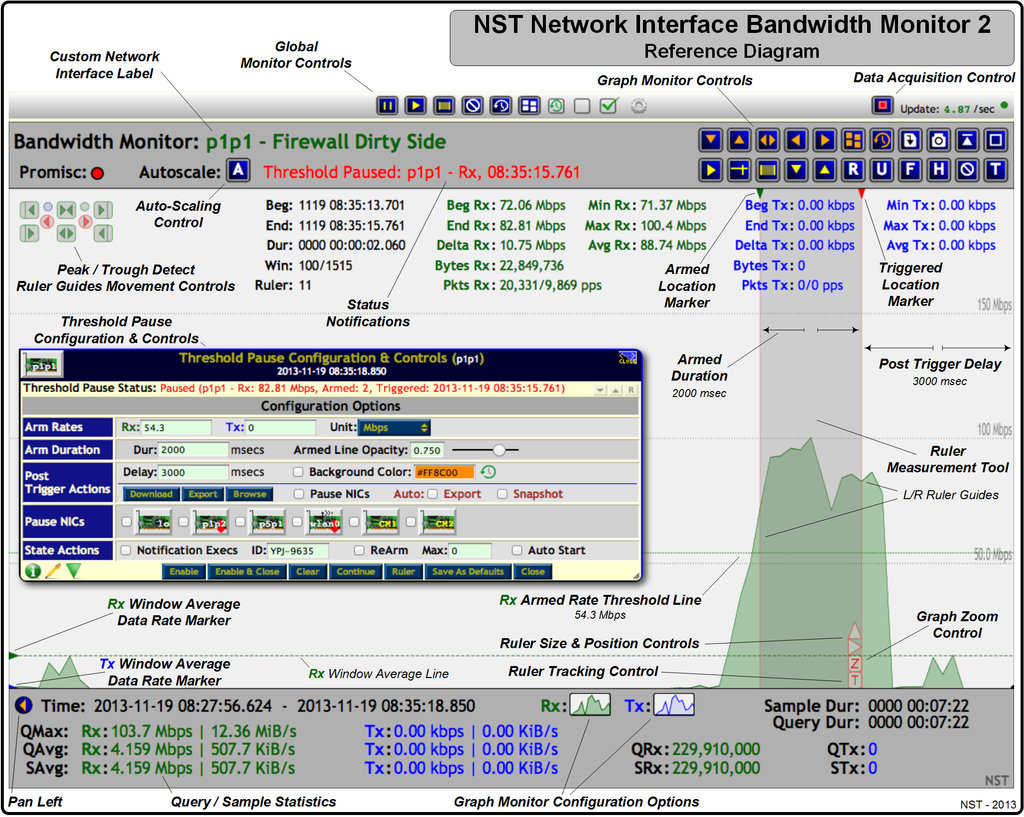
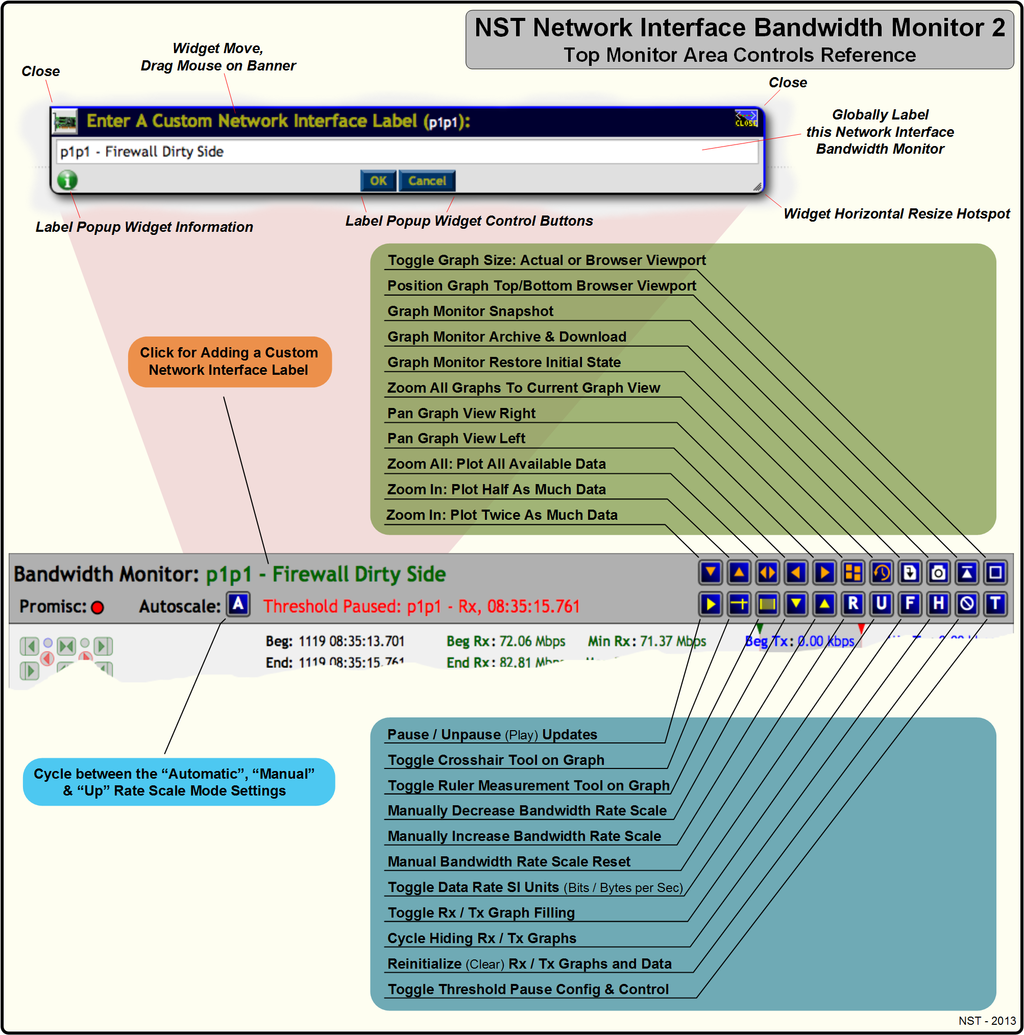
Use this section as a reference for location and description of all controls available with the NST Network Interface Bandwidth 2 Monitors. The image below can serve as a general reference diagram for a single Bandwidth Monitor. Many of the Bandwidth Monitor features have been identified and marked on the image. A Threshold Pause feature that allows "Pausing" of one or more Bandwidth Monitoring graphs when a configured Threshold Armed Rate value is Reached or Exceeded (i.e., Triggered) is also shown. Custom executables can also be run each time a Threshold Pause state change occurs. As an example, one could initiate a network packet capture when a sustained bandwidth data rate exceeds a certain level.
The reference diagram below depicts a Threshold Pause session that was configured on the "p1p1 Bandwidth Monitoring" graph with an Armed Rx bandwidth data rate of: "54.3 Mbps". This bandwidth rate was maintained for the Armed duration of "2000 msecs" as a condition for the Threshold Trigger to occur. A Threshold Trigger event did occur on 2013-11-19 08:35:15.761 at an Rx data rate value of: "82.81 Mbps". A Post Trigger Delay of "3 seconds" was in effect. No additional bandwidth monitoring graphs were set to be Paused. A query rate of "200 msec" was also configured for bandwidth monitor graph updates.
All notification executables located in directory: "/etc/nst/notifications/bwmon" were run at each Threshold Pause state change and marked with ID: "YPJ-9635".
The traffic generated for this example was from a YUM update. A Dualcomm ETAP-3105 TAP was used on the external side of a firewall and presented the network traffic to interface: "p1p1".
Global Monitor Controls
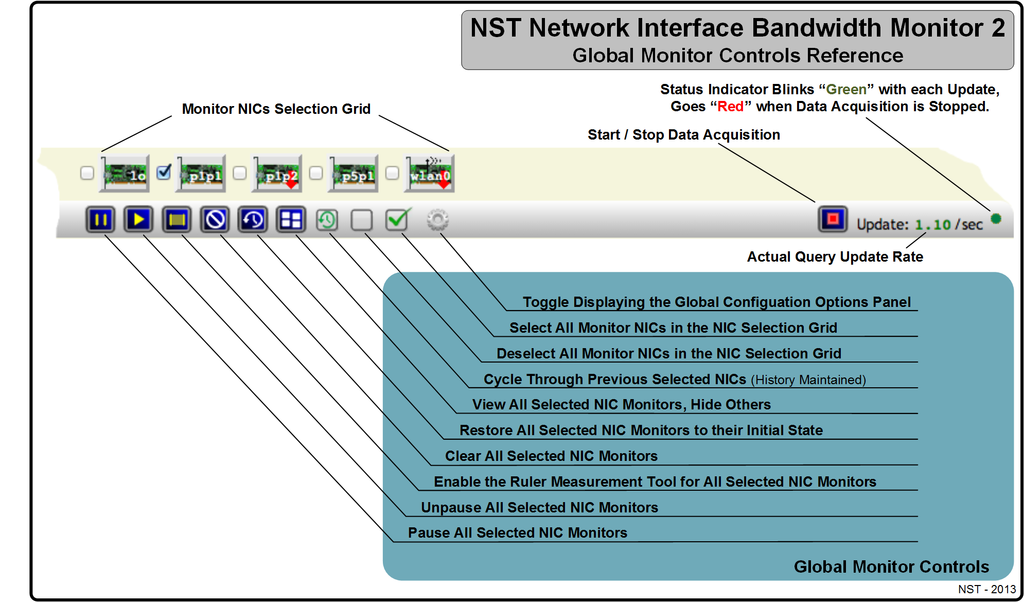
The reference diagram below provides a brief description of each Global Monitor Controls associated with an NST Network Interface Bandwidth Monitor 2. NST WUI tool tips are also available for each icon providing a descriptive usage dialog.
Graph Monitor Controls
The reference diagram below provides a brief description of each Graph Monitor Control buttons associated with an NST Network Interface Bandwidth Monitor 2 Graph. Browser tool tips are also available for each button and notification area providing a descriptive usage dialog.
Peak Trough Detection & Ruler Tool Resize & Movement Controls
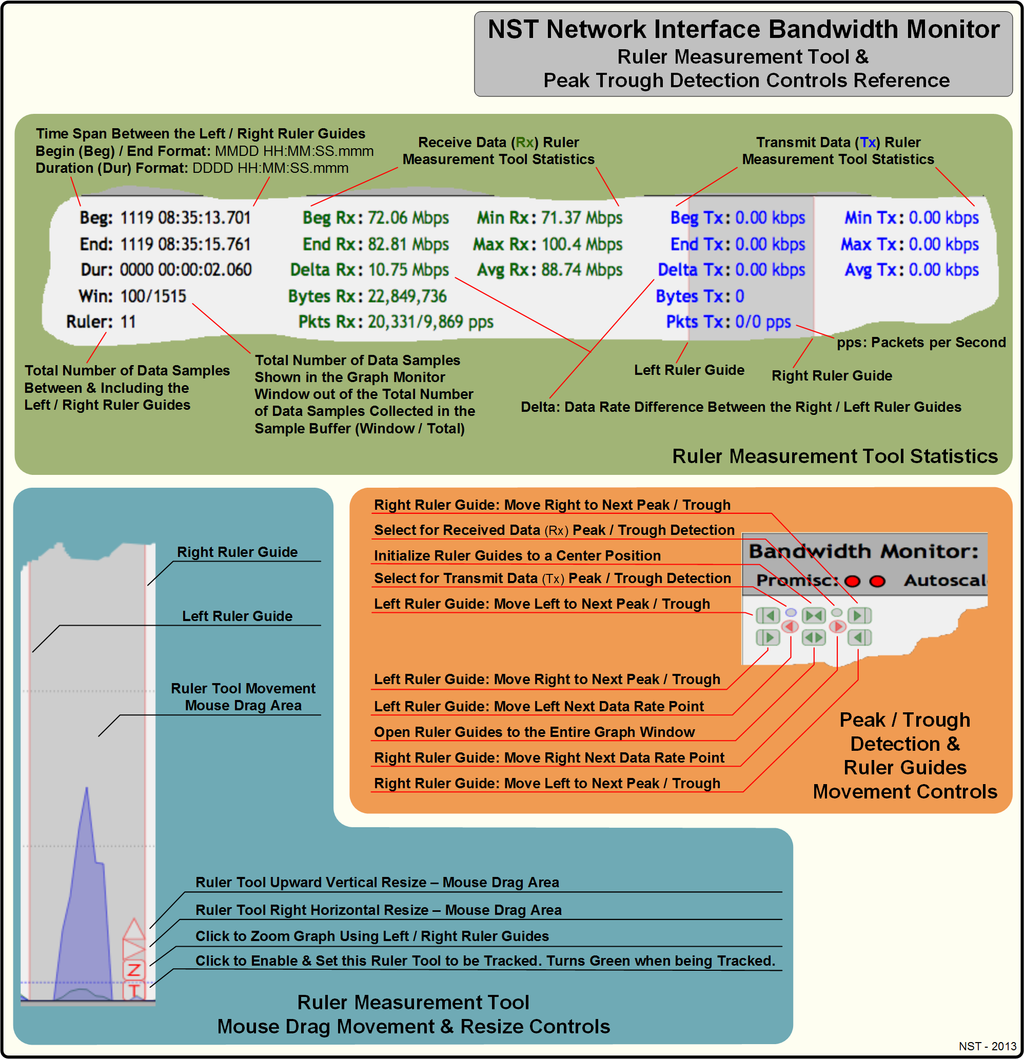
The reference diagram below provides a brief description of the Peak / Trough Detection & the Ruler Measurement Tool Resize & Movement Control buttons available with each NST Network Interface Bandwidth Monitor 2 Graph. NST WUI tool tips are also available for each button or action providing a more descriptive usage dialog.
The Ruler Tool is handy for time and bandwidth rate analysis. One can navigate the tool by moving the mouse cursor in between the left and right ruler guides and then dragging it accordingly with your mouse device. The left and right ruler guides serve as the start and stop position for the displayed time and bandwidth rate analysis results. When the Ruler Tool is shown, one can also position the tool to the current cursor position by clicking on the graph.
The Peak / Trough Detection tool is useful for positioning the Left and Right Ruler Tool Guides exactly at a bandwidth data rate peak or trough value to perform measurements with the ruler tool.
Crosshairs Tool
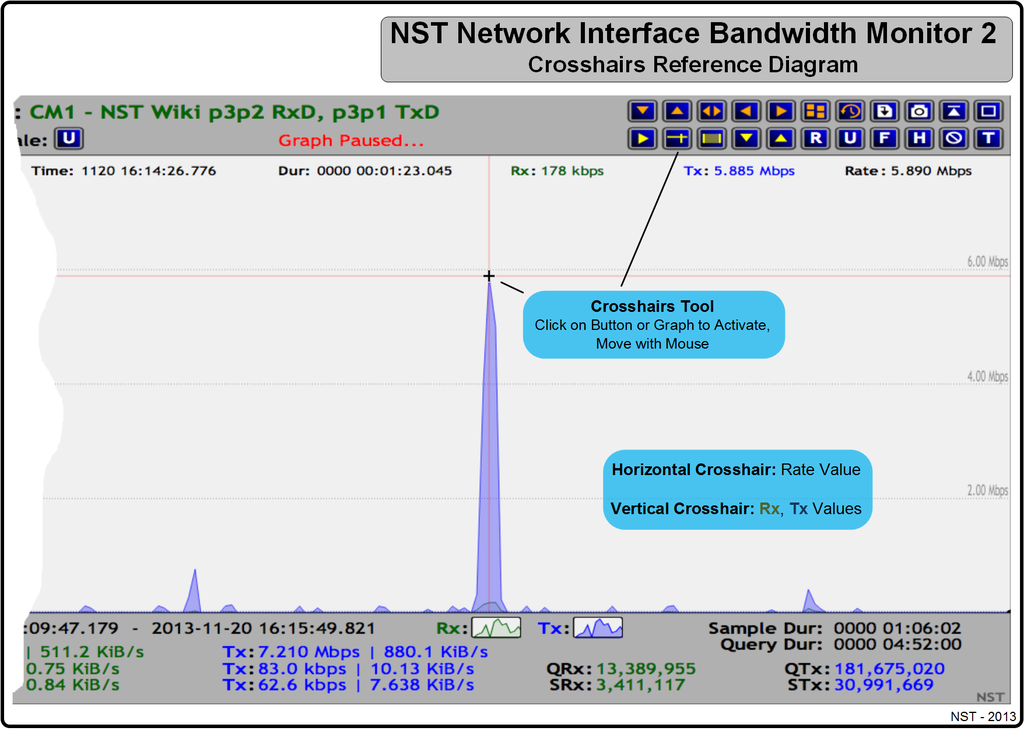
The reference diagram below provides a brief description of the Crosshairs Tool available with each NST Network Interface Bandwidth Monitor Graph. The Crosshairs Tool can be activated by clicking on either the graphing area of a Bandwidth Monitor or using the Crosshairs button.
The Crosshairs Tool displays the data acquisition time, window data duration from the right graph edge or if zoomed in, the from the end of the sample buffer and the data bandwidth rates. The horizontal Crosshair is used to calculate the bandwidth rate for the mouse cursor position and is displayed in black in the upper right hand corner of the graph. The vertical Crosshair is used to calculate the bandwidth rate for both the Receive (Rx) and the Transmit (Tx) data and is displayed in "Green" and "Blue" respectively.
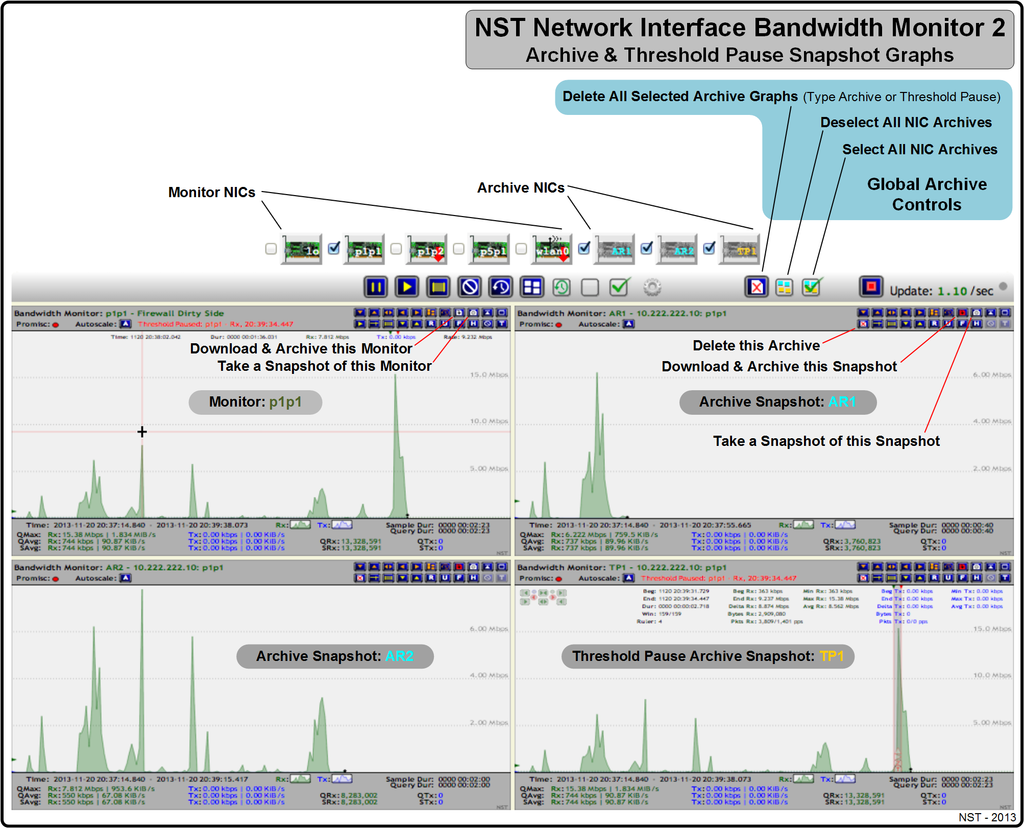
Archive & Threshold Pause Snapshots
