Multi-Tap Network Packet Capturing: Difference between revisions
No edit summary |
|||
| (410 intermediate revisions by 2 users not shown) | |||
| Line 1: | Line 1: | ||
== Overview == | == '''Overview''' == | ||
This section will demonstrate the use of '''Multi-Tap Network Packet Capture''' with NST. The NST WUI implementation supports simultaneous | This section will demonstrate the use of '''Multi-Tap Network Packet Capture''' with NST. The NST WUI '''Network Packet Capture''' implementation supports simultaneous packet capture on up to 4 network interfaces (Quad Tap) per multi-tap capture session. Multi-segment network packet capture and decode analysis can be performed. NST uses the '''[http://www.wireshark.org Wireshark]''' network protocol analyzer suite for network packet capture and decode. Essentially this implementation provides a web-based '''[http://en.wikipedia.org/wiki/Packet_sniffer Packet Sniffer]''' for capturing network traffic and supports the use of up to 4 concurrent network interfaces. Multiple layered protocol decode analysis pages are provided based on both '''[http://www.nbee.org/doku.php?id=netpdl:psml_specification PSML]''' and '''[http://www.nbee.org/doku.php?id=netpdl:pdml_specification PDML]''' generated output. | ||
This document was written using v1.5.0 through v2.13.0 release of the '''NST WUI'''. | |||
== | == '''Theory Of Operation''' == | ||
Prior to commencing a multi-tap capture session, each ''enabled'' "'''Network Interface Tap'''" interface must be associated with a registered network interface on the NST probe. Up to 4 "'''Tap'''" interfaces can be ''enabled''. A "'''Tap'''" interface is ''independent'' of any registered network interface on the NST probe. By assigning a separate network interface to each "'''Tap'''", it is possible to perform a network capture as packets ''flow'' across a networking device (e.g., router or firewall). One can also associate the ''same'' network interface to multiple "'''Tap'''" interfaces. This allows one to apply a different "'''Capture Filter'''" for the same network interface during packet capture. | |||
== Multi-Tap Network Packet Capture: Traffic Between Gigabit Switches == | A "'''Capture Data Directory'''" must also be selected for the resultant merged multi-tap capture file, multi-tap log file and if chosen, the individual tap member capture files. One should consider using a "'''RAM'''-based" file system for packet storage while capturing data packets on high traffic network segments. The Linux "'''RAMFS'''" or "'''TMPFS'''" file systems make excellent choices. The NST WUI provides convenient access for the creation of either one of these file systems during multi-tap capture setup. | ||
The '''[http://www.wireshark.org Wireshark]''' light-weight network packet capture tool: "'''dumpcap'''" is used as the capture engine. Each enabled "'''Tap'''" interface will run a separate "'''dumpcap'''" process when the multi-tap capture session is started. Each "'''dumpcap'''" process can be configured to have a separate "'''Capture Filter'''" and other associated options. | |||
A "'''Multi-Tap Merge Manager'''" process is also started when the multi-tap capture session is commenced. The "'''Multi-Tap Merge Manager'''" is responsible for monitoring each separate "'''dumpcap'''" process during the course of the multi-tap capture session. If any ''one'' multi-tap member "'''dumpcap'''" process terminates, the "'''Multi-Tap Merge Manager'''" will terminate all other "'''dumpcap'''" processes associated with the multi-tap capture session. Typically, a termination threshold (i.e. '''Duration''', '''File Size''' or '''Packet Count''') that has been satisfied is the usual reason for a "'''dumpcap'''" process to terminate. Once all "'''dumpcap'''" processes have been terminated, all "'''Tap'''" member capture files will then be ''merged'' using the '''[http://www.wireshark.org Wireshark]''' "'''mergecap'''" utility resulting with a multi-tap capture file. Each individual "'''Tap'''" member capture file will normally be ''deleted'' after the merge by the "'''Multi-Tap Merge Manager'''" unless an option was selected to ''disable'' removal of these files. A multi-tap capture log file will also be produced by merging all multi-tap member log files. The multi-tap capture log file contains relevant "'''Tap'''" member information and identity for historical multi-tap decode analysis. | |||
The NST WUI is session state aware for each attached browser client. This means that each user or multiple users can in many areas of the NST WUI have their own separate configuration and operation. The NST WUI '''Multi-Tap Network Packet Capture''' implementation is fully session state capable. Based on this, '''''multiple instances''''' of a multi-tap capture session can occur simultaneously. This type of operation is typically more suited to an enterprise deployment of NST on systems configured with 8 or more network interfaces. | |||
== '''Network Tap''' == | |||
When capturing packets at Gigabit Ethernet rates and one needs <u>total</u> ''visibility'' on the link, then a passive network tap is required. [http://www.netoptics.com Net Optics], a global leader in passive monitoring, makes an excellent 10/100/1000BaseT Tap ([http://www.netoptics.com/products/product_family_details.asp?cid=1&pid=141&Section=products&menuitem=1&tag=NetOptics+Network+Taps TP-CU3]) for passively allowing access to monitor GigaBit traffic. | |||
The [http://www.netoptics.com/products/product_family_details.asp?cid=1&pid=141&Section=products&menuitem=1&tag=NetOptics+Network+Taps TP-CU3] tap also allows for full-duplex traffic as if it were in-line (i.e, line rate non-blocking speeds), including Layer 1 and Layer 2 errors to be presented to the NST multi-tap capture interface. Typically a [http://en.wikipedia.org/wiki/Port_mirroring switch mirroring port] may drop layer 1 and select layer 2 errors depending on what has been deemed as high priority for that particular switch. | |||
The '''[http://www.ntop.org ntop]''' project has an excellent article on "'''[http://www.ntop.org/blog/?p=14 Port Mirror vs Network Tap]'''" which describes in detail the differences between these two techniques in providing access to network packets. | |||
== Configuration 1: Multi-Tap Network Packet Capture Across A Firewall - NAT/PAT Traffic == | |||
The diagram depicted below shows an example '''Multi-Tap Capture Setup''' for monitoring GigaBit traffic across a firewall boundary. One may need to explore the capturing of packets as they transverse the firewall and undergo both '''Network''' and '''Port Address Translation''' ('''NAT'''/'''PAT'''). | |||
[[Image:Nst_quad_tap_networking.png|center]] | |||
== Configuration 2: Multi-Tap Network Packet Capture - Traffic Between Gigabit Switches == | |||
The diagram displayed below shows an example '''Dual-Tap Capture Setup''' for monitoring network traffic between 2 Gigabit switches. In this case a generic notebook computer was used and configured with 3 network interfaces (A built-in Gigabit LAN adapter, a Gigabit LAN adapter PC-Card and a built-in 802.11g/n wireless adapter for secure remote access and | The diagram displayed below shows an example '''Dual-Tap Capture Setup''' for monitoring network traffic between 2 Gigabit switches. In this case a generic notebook computer was used and configured with 3 network interfaces (A built-in Gigabit LAN adapter, a Gigabit LAN adapter PC-Card and a built-in 802.11g/n wireless adapter for secure remote access and | ||
control of '''NST'''). | control of '''NST'''). | ||
| Line 18: | Line 38: | ||
== Example 1: Multi-Tap Network Packet Capture Session Step-By-Step == | == '''Example 1: Multi-Tap Network Packet Capture Session Step-By-Step''' == | ||
This section will demonstrate a '''Multi-Tap Network Packet Capture''' session using 2 network adapters ('''eth1''' and '''eth2''') as the ''target'' capture interfaces. We will concentrate on '''email''' traffic ('''POP''' and '''SMTP''') occurring on network: "'''172.28.8.0/24'''". It is assumed that the '''NST''' probe has sufficient network interface adapters (at least 2 in this case) to perform this capture and that these interfaces are attached to a [http://www.netoptics.com network tap] similar to what is shown in the diagrams above or some type of [http://en.wikipedia.org/wiki/Port_mirroring port mirroring] (e.g., '''SPAN''' - Switched Port Analyzer) configuration. | This section will demonstrate a '''Multi-Tap Network Packet Capture''' session using 2 network adapters ('''eth1''' and '''eth2''') as the ''target'' capture interfaces. We will concentrate on '''email''' traffic ('''POP''' and '''SMTP''') occurring on network: "'''172.28.8.0/24'''". It is assumed that the '''NST''' probe has sufficient network interface adapters (at least 2 in this case) to perform this capture and that these interfaces are attached to a [http://www.netoptics.com network tap] similar to what is shown in the diagrams above or some type of [http://en.wikipedia.org/wiki/Port_mirroring port mirroring] (e.g., '''SPAN''' - Switched Port Analyzer) configuration. | ||
| Line 30: | Line 50: | ||
=== Step: 2 Multi-Tap Interfaces & Data Directory Selection === | === Step: 2 Multi-Tap Interfaces & Data Directory Selection === | ||
Use the navigational aid link: | Use the navigational aid link: [<span style="color: blue; font-weight: bold;">Select Tap Interfaces/Directory</span>] to go to the "'''Multi-Tap Interfaces & Data Directory Selection'''" section. This is where you select the target capture interfaces and data directory on the '''NST''' probe when you will store your multi-tap capture. We will enable '''Network Interface Taps''': "'''Tap0'''" and "'''Tap1'''" and assign each one to a registered network interface on the NST probe. | ||
[[Image:Multi-tap_int_data_dir.png|center|frame|Multi-Tap Interfaces & Data Directory Selection]] | [[Image:Multi-tap_int_data_dir.png|center|frame|Multi-Tap Interfaces & Data Directory Selection]] | ||
| Line 41: | Line 61: | ||
Both interfaces are initially shown in the "'''Down'''" state indicated by the '''<span style="color: red;">red</span>''' down arrow superimposed on the "'''NIC Adapter'''" icons. The network interface will automatically be put in the "'''Up'''" state prior to starting a capture session. | Both interfaces are initially shown in the "'''Down'''" state indicated by the '''<span style="color: red;">red</span>''' down arrow superimposed on the "'''NIC Adapter'''" icons. The network interface will automatically be put in the "'''Up'''" state prior to starting a capture session. | ||
=== Step: 3 Start Multi-Tap Capture Form === | === Step: 3 Start Multi-Tap Capture Form === | ||
| Line 50: | Line 69: | ||
Fill in the form similar to what is shown above. Optionally use the | Fill in the form similar to what is shown above. Optionally use the action: [<span style="color: blue;">'dumpcap' Capture Filter Expressions</span>] to help fill in the "'''dumpcap'''" capture filter expression field for each Tap. Each Tap can have a ''unique'' "'''dumpcap'''" capture filter expression. Use: "'''Monitor Start'''" as one of the "'''WUI Startup Options'''". Adjust your capture termination thresholds accordingly. In this case, the capture will terminate automatically when either of the following thresholds have been exceeded: a "'''10 seconds'''" capture time has elapsed, a file size of: "'''4MB'''" has been reached or "'''100'''" network packets have been collected. | ||
=== Step: 4 Multi-Tap Network Packet Capture Start === | === Step: 4 Multi-Tap Network Packet Capture Start === | ||
| Line 60: | Line 78: | ||
Near real-time dynamic updates using [http://en.wikipedia.org/wiki/AJAX AJAX] will occur until one of the termination thresholds is reached. Once termination has been reached, another automatic sequence of '''NST WUI Multi-Tap Network Packet Capture''' pages will now appear until the "'''Multi-Tap Capture Summary'''" section is now displayed as show below: | Near real-time dynamic updates using [http://en.wikipedia.org/wiki/AJAX AJAX] will occur until one of the termination thresholds is reached. Once termination has been reached, another automatic sequence of '''NST WUI Multi-Tap Network Packet Capture''' pages will now appear until the "'''Multi-Tap Capture Summary'''" section is now displayed as show below: | ||
[[Image:Multi-tap_summary_capture.png|center|frame|Multi-Tap Network Packet Capture Summary]] | [[Image:Multi-tap_summary_capture.png|center|frame|Multi-Tap Network Packet Capture Summary]] | ||
One can see from the "'''capinfos'''" summary output that the '''packet count''' termination threshold of: "'''100 Packets'''" caused the capture session to end. | One can see from the '''[http://www.wireshark.org Wireshark]''' "'''capinfos'''" summary output that the '''packet count''' termination threshold of: "'''100 Packets'''" caused the capture session to end. | ||
=== Step: 5 Multi-Tap Network Packet Capture Decode Analysis === | |||
At this point we are now ready to perform a decode of the packet capture. Use the [<span style="color: blue; font-weight: bold;">New Decode</span>] navigation aid link to go to the "'''Multi-Tap Text-Based Protocol Analyzer Decode'''" section. | |||
== '''Example 2: Multi-Tap Network Packet Capture Across A Firewall Boundary - NAT/PAT Traffic''' == | |||
This example will explore network packet traffic as it flows across a firewall device. We will use a remote "'''SSH'''" client ''request'' and "'''SSH'''" server ''response'' for this demonstration and explore the '''NAT'''/'''PAT''' translation that occurs by decoding the capture. The following diagram shows the network environment for this multi-tap capture. The "'''SSH'''" client is located remotely on the Internet using IP Address: '''24.97.150.194''' and the "'''SSH'''" server is '''NAT'''/'''PAT''' translated using IP Address: '''69.205.41.87:22222''' its real ''internal'' IP Address is: '''10.222.222.14:22'''. | |||
[[Image:Nst_multi_tap_networking_firewall.png|center]] | |||
We will be using 3 tap interfaces ('''Tap0 - 2''') for this multi-tap capture. The '''Hub''' works in "'''Half-Duplex'''" mode and presents both the '''Transmit''' and '''Receive''' network traffic from the "'''Dirty'''" (unfiltered) side of the '''Firewall''' device to: "'''Tap0: eth2'''". Taps "'''1'''" and "'''2'''" will be connected to a [http://www.netoptics.com Net Optics] Gigabit copper tap: [http://www.netoptics.com/products/product_family_details.asp?cid=1&pid=141&Section=products&menuitem=1&tag=NetOptics+Network+Taps TP-CU3] for capturing network traffic between the '''Firewall''' device and the '''Gigabit Switch'''. | |||
=== Multi-Tap Interfaces & Data Directory Selection Form: NAT/PAT SSH Traffic === | |||
Prior to starting up a capture session, each enabled "'''Network Interface Tap'''" must be associated with a registered network interface on the NST probe. In this example network interface: "'''eth2'''" is assigned to: "'''Tap0'''", network interface: "'''eth1'''" is assigned to: "'''Tap1'''" and network interface: "'''eth3'''" is assigned to: "'''Tap2'''". Leave "'''Tap3'''" ''Disabled''. | |||
[[Image:Nst_multi_tap_networking_firewall_int_cap_dir_selection.png|center|frame|Multi-Tap Interfaces & Data Directory Selection Form: NAT/PAT SSH Traffic]] | |||
A "'''Capture Data Directory'''" must also be selected for capture and log file storage. In this case we have chosen directory: "'''/tmp/pkt/wikidemo'''". Use the "'''Select Multi-Tap Interfaces/Capture Data Directory'''" button to register this configuration with the current '''Multi-Tap Network Packet Capture''' session. This will ''build'' out the appropriate corresponding "'''Multi-Tap Start Capture'''" form which is shown below. | |||
=== Multi-Tap Network Interface Information (eth2): NAT/PAT SSH Traffic === | |||
The "'''Multi-Tap Interfaces & Data Directory Selection'''" form also includes network interface action icons allowing one to view specific information and control various properties of a network interface. Dynamic counter values and setting updates will occur periodically via [http://en.wikipedia.org/wiki/AJAX AJAX]. | |||
[[Image:Nst_multi_tap_networking_firewall_nic_adapter_info.png|center|frame|Multi-Tap Network Interface Information (eth2): NAT/PAT SSH Traffic]] | |||
The above view was enabled by ''clicking'' on the "'''eth2'''" '''NIC''' icon. This pop-up view can be ''dragged'' around within your browser's window. This is accomplished by first moving your mouse cursor to the top header control area ('''Note:''' the cursor icon should change to the "'''move'''" icon) and then secondly while holding down the "'''left'''" mouse control button the view can be ''dragged'' to your desired location. | |||
A pop-up network interface view for each registered network interface can be shown simultaneously. The dynamic update period for counter values and settings can be changed using the parameter value: "'''Network Interface Information Update Interval'''" found on the NST WUI: "'''Global/Session Configuration Management'''" page section: "'''DOM Session Configuration'''". | |||
=== Multi-Tap Start Capture Form: NAT/PAT SSH Traffic === | |||
After registering the ''enabled'' "'''Network Interface Taps'''" and "'''Capture Data Directory'''" above, the "'''Multi-Tap Start Capture'''" form should contain input fields for "'''Tap0'''", "'''Tap1'''" and "'''Tap2'''" as shown below. For this example we chose to use a ''small'' "'''Packet Count'''" termination threshold value of "'''8 Packets'''" to control when the multi-tap capture session will end. Once any "'''dumpcap'''" process has captured "'''8 Packets'''" or more, the entire multi-tap capture session will complete. The other 2 capture termination thresholds: "'''Duration'''" and "'''File Size'''" will be set to large values and will unlikely be the cause of capture termination. A quick way to set the capture termination thresholds shown is to select the action: [<span style="color: blue;">Long Capture Session</span>] and then adjust the "'''Packet Count'''" termination threshold to: "'''8 Packets'''". | |||
On the public external side a "'''dumpcap'''" capture filter expression: '''-f 'host 69.205.41.87 and (tcp port 22222)'''' is applied to network interface tap: "'''tap0:eth2'''". This filter states that only packets to or from IP Address: "'''69.205.41.87'''" ''And'' having a source or destination TCP/IP port: "'''22222'''" will be captured. | |||
On the private internal side the same "'''dumpcap'''" capture filter expression: '''-f 'host 10.222.222.14 and (tcp port ssh)'''' is applied to network interface tap: "'''tap1:eth1'''" and tap: "'''tap2:eth3'''". This filter states that only packets to or from IP Address: "'''10.222.222.14'''" ''And'' having a source or destination TCP/IP port: "'''ssh (22)'''" will be captured. | |||
'''Hint:''' A convenient action: [<span style="color: blue;">'dumpcap' Capture Filter Expressions</span>] can be used to automate the process of filling in a desired capture filter expression. This action allows one to '''create''', '''edit''', '''restore''', '''save''' or '''load''' your favorite set of capture filter expressions. The action: [<span style="color: blue;">Replicate</span>] can then be used to populated the selected capture filter expression to all other multi-tap member capture filter expression fields. | |||
There are no additional "'''dumpcap'''" options used for this example. | |||
[[Image:Nst_multitap_networking_firewall_start_capture.png|center|frame|Multi-Tap Start Capture Form: NAT/PAT SSH Traffic]] | |||
For historical purposes, it is important that one annotates the capture appropriately. Each network tap interface section provides an annotation entry field. There is also a multi-tap capture session annotation entry field. Annotations are very useful and will appear in various tooltip status views throughout the NST WUI '''Network Packet Capture''' implementation and can be later searched on using the "'''Network Packet Capture Management & Status'''" page. | |||
We have chosen ''not'' to ''remove'' the individual capture files produced from each "'''dumpcap'''" process after the multi-tap capture merge has taken place. This is indicated by the checkbox selection next to the | |||
"'''Disable Tap Capture/Log Removal'''" text. One may want to retain | |||
the individual capture file components as well as the multi-tap capture to perform a rigorous comprehensive decode analysis requiring original data. | |||
The "'''Monitor Start'''" option with an update period of "'''5'''" seconds has also been selected. | |||
This allows for dynamic capture status updates to occur every "'''5'''" seconds using [http://en.wikipedia.org/wiki/AJAX AJAX] until the multi-tap capture session terminates. | |||
=== Multi-Tap Pending Capture: NAT/PAT SSH Traffic === | |||
The multi-tap network packet capture session is now configured to start. "'''The Multi-Tap Network Packet Capture Start'''" button shown above is used to commence the capture. Since the "'''Monitor Start'''" option was selected, a series of pages will automatically sequence until the '''Pending Multi-Tap Capture''' page appears below. This page will remain ''active'' until the packet capture count threshold of "'''8'''" packets is reached. Periodic updates occurring every "'''5'''" seconds via an [http://en.wikipedia.org/wiki/AJAX AJAX] transaction will refresh this page with current capture status information. An '''SSH''' "'''request/response'''" transaction was initiated on the remote '''SSH''' client and was captured for this demonstration. | |||
Each individual tap "'''dumpcap'''" command is also shown in its entire form. One may find it convenient to "''copy''" and "''paste''" a complete "'''dumpcap'''" command for command line usage or to check for proper options passed to a particular "'''dumpcap'''" command. | |||
[[Image:nst_multi_tap_networking_firewall_pending_capture.png|center|frame|Multi-Tap Pending Capture: NAT/PAT SSH Traffic]] | |||
'''Hint 1:''' Click on a '''NIC''' icon to ''view'' network interface information for that capture interface during a real-time multi-tap network packet capture session. One may observe if traffic is being received or not on a network interface even though the capture filter expression in ''effect'' is discarding the capturing of these packets. | |||
'''Hint 2:''' Click on a Tap interface button (e.g., "'''Tap2: eth3'''") to perform decode analysis on the associated "'''dumpcap'''" capture file using the NST WUI "'''Single-Tap Network Packet Capture'''" implementation. This procedure can occur during a '''live''' multi-tap network packet capture session. Use this technique to ascertain if sufficient data has already been captured. If this is the case, one may then terminate the capture session ''manually''. | |||
The "'''Terminate Multi-Tap Capture'''" button allows one to ''manually'' stop the current multi-tap network packet capture session in progress. | |||
=== Multi-Tap Capture NST WUI And Capinfos Summary Section: NAT/PAT SSH Traffic === | |||
Once a multi-tap network packet capture session has completed, decode and analysis using the multi-tap capture file can be performed. The caption below shows the output from the '''[http://www.wireshark.org Wireshark]''' "'''capinfos'''" command and NST WUI summary information for the multi-tap capture file: "'''/tmp/pkt/wikidemo/capture_mtap.cap'''". This section is initially displayed right after the multi-tap capture session has terminated. | |||
[[Image:Nst_multi_tap_networking_firewall_summary.png|center|frame|Multi-Tap Capture NST WUI And Capinfos Summary Section]] | |||
=== Multi-Tap Capture ToolTip Summary : NAT/PAT SSH Traffic === | |||
The caption below also shows a summary view of the current multi-tap capture file. One can enable this view by ''hovering'' your mouse pointer over the <span style="color: black; font-size: 90%; font-weight: bold;">Multi-Tap Capture Status: "<span style="color: green;">Capture Available</span>"</span> header information at the top of the '''Multi-Tap Network Packet Capture''' page. | |||
'''Note 1:''' The total number of packets captured: "'''22'''" was the sum of "'''8'''" packets captured on network interface: "'''Tap0: eth2'''", "'''8'''" packets captured on "'''Tap1: eth1'''" and "'''6'''" packets captured on "'''Tap2: eth3'''". | |||
'''Note 2:''' The multi-tap capture termination threshold of "'''8'''" packets was reached on both network interface "'''Tap0'''" and "'''Tap1'''" which caused the capture session to complete. | |||
'''Note 3:''' The multi-tap capture session duration is: "'''+0000 00:00:22'''" ('''22''' seconds) while the duration between the '''first''' and '''last''' packet captured is: "'''+0000 00:00:16.832639'''" ('''16.832639''' seconds). It is important to distinguish between these two different duration values for capture analysis. | |||
We will now demonstrate various types of ''decodes'' and ''analyses'' using the multi-tap capture file. Use the [<span style="color: blue; font-weight: bold;">New Decode</span>] navigation link to move to the "'''Multi-Tap Text-Based Protocol Analyzer Decode'''" section. | |||
[[Image:Nst_multi_tap_networking_firewall_status.png|center|frame|Multi-Tap Capture Summary Status ToolTip]] | |||
=== Multi-Tap Capture Decode Form: NAT/PAT SSH Traffic === | |||
The NST WUI multi-tap decode section contains many different options, features and ways to decode the capture file. A few different decode scenarios using the multi-tap capture file will be now presented. First time users are encouraged to explore the many different ways that one can decode and view the captured packets. This will help one get a better feel for the NST WUI decode implementation and become more proficient with its use. | |||
'''Note:''' For completeness, the "'''Advanced Decode Protocol Analyzer Options'''" as shown in the caption below. Typically, these options do '''not''' have to be displayed to perform a routine packet decode. | |||
[[Image:Nst_multi_tap_networking_firewall_decode_form.png|center|frame|Multi-Tap Capture Decode Form]] | |||
A basic decode using the '''[http://www.wireshark.org Wireshark]''' "'''tshark'''" command will be shown first to demonstrate the '''NAT/PAT''' translation through the Firewall device. The "'''tshark'''" display filter expression: '''-R 'frame.number >= 1 && frame.number <= 4'''' is used to limit the number of multi-tap captured packets to decode to the first "'''4'''" packets in the capture out of a total of "'''22'''" packets. | |||
'''Hint:''' Use the [<span style="color: blue; font-weight: bold;">Frame Filter</span>] action link as a convenient means for adding an example capture display frame filter: '''-R 'frame.number >= 1 && frame.number <= 10'''' to the "'''Display Filter Expression'''" field. Modify it accordingly to help limit the size of your decode output. | |||
=== Multi-Tap Capture Decode Summary: NAT/PAT SSH Traffic === | |||
The caption below contains the summary decode that was produced by selecting the "'''Use tshark To Decode'''" button. The decode has been labeled and documented for clarity. One can see the occurrence of the inbound '''NAT/PAT''' translation through the firewall device for the encrypted '''SSH''' "'''request'''" with packets: "'''1'''" and "'''2'''". The outbound '''NAT/PAT''' translation occurred through the firewall device for the encrypted '''SSH''' "'''response'''" with packets: "'''3'''" and "'''4'''". | |||
With multi-tap network packet capturing, one can derive and quantify the average time packets take to ''transverse'' a '''Layer 3''' device (i.e., in this case the Firewall). For this demonstration, on average, '''373''' microseconds is consumed by the Firewall when passing '''SSH''' packets requiring '''NAT/PAT''' translation. | |||
[[Image:Nst_multi_tap_networking_firewall_decode.png|center]] | |||
'''Note:''' Each packet has been identified by which network interface tap it was "'''Captured On'''". | |||
=== Multi-Tap Capture PDML TCP/IP Decode: NAT/PAT SSH Traffic === | |||
There are many different types of "'''Specialized tshark Decode Output Formats'''" available with the NST WUI '''Multi-tap Network Packet Capture''' implementation. The snapshot below is an NST WUI "'''TCP/IP'''" summary view decode output representation derived from a [http://www.nbee.org/doku.php?id=netpdl:pdml_specification PDML] document produced by "'''tshark'''". It was generated by selecting the "'''TCP/IP Traffic'''" button. | |||
Various capture display filter expressions can be easily created by just ''clicking'' on an active table cell. A pop-up tooltip will inform you on what action is available for the particular table cell that your mouse pointer is currently located over. As seen below, a dynamic follow "'''TCP/IP Stream Display Filter'''" expression can be generated and used with a new "'''tshark'''" decode session by just clicking on the "'''0x18 (PSH, ACK)'''" '''TCP/IP Flags''' table cell for packet: "'''4'''". In this case, if clicked on, a new NST WUI '''Multi-tap Network Packet Capture''' page will loaded and populated with this "'''tshark'''" capture display filter expression: '''-R '(ip.addr eq 69.205.41.87 and ip.addr eq 24.97.150.194) and (tcp.port eq 22222 and tcp.port eq 41909)''''. This type of display filter is ''extremely'' useful when your capture file contains literally thousands of '''TCP/IP''' transactions and you need to isolate a particular one. | |||
'''Note:''' The "'''Frame Num'''" ('''Frame Number''') label is equivalent to "'''Packet Number'''". | |||
[[Image:Nst_multi_tap_networking_firewall_pdml_tcpip.png|center|frame|Multi-Tap Capture PDML TCP/IP Decode]] | |||
Different time formats for each '''TCP/IP''' packet can be displayed and change dynamically using the "'''Relative Time'''", "'''Delta Time Previous'''" and "'''Delta Time First'''" buttons. As shown above, the "'''Delta Time Previous'''" button was selected displaying the "'''Delta Time'''" in seconds from the "'''Previous'''" packet time. The use of this time format reveals the time delay through the Firewall device and is shown for packets: "'''2'''" ('''0.000361000''' seconds) and "'''4'''" ('''0.000385000''' seconds). | |||
From a network perspective, it took the '''SSH''' server '''0.000536000''' seconds to respond to the '''SSH''' request. | |||
=== Multi-Tap Capture PDML Network Packet Details Decode: NAT/PAT SSH Traffic === | |||
The following specialized decode output format: "'''Multi-Tap Network Packet Details'''" allows one to ''visualize'' each network packet in a layered structure format (e.g., [http://en.wikipedia.org/wiki/Internet_protocol_suite Internet Protocol Suite]). One can drill down to the bit level to determine the value of a flag setting or an option associated with a specific protocol layer for an individual packet. The ability to "'''collapse'''" and "'''expand'''" packet and protocol layer information is provided to enhance visibility into the depth of your capture decode. | |||
'''Expanded Mode:''' Each "'''Frame'''" ('''Packet''') can be ''expanded'' detailing information about the protocols found within the packet. Click on a packet folder close icon [[Image:Folderclose.gif]] to view detailed protocol layer information for an individual packet. Use the "'''Expand All Frames'''" button to view detailed protocol layer information for "'''All'''" packets shown. Each "'''Protocol'''" layer can be ''expanded'' for a given packet revealing a detailed decode description for that specific protocol. Click on a dial collapse icon [[Image:Dialcollapse.gif]] to view detailed information about a specific protocol layer for an individual packet. Click on a dial collapse all icon [[Image:Dialcollapseall.gif]] to view detailed information for "'''All'''" protocol layers within an individual packet. Use the "'''Expand All Protocol Blocks'''" button to view detailed information for "'''All'''" protocol layers found for each packet shown. | |||
'''Collapsed Mode:''' Each "'''Packet'''" can be ''collapsed'' showing only a summary of the protocols found within the packet. Click on a packet folder open icon [[Image:Folderopen.gif]] to hide detailed protocol layer information for an individual packet. Use the "'''Collapse All Frames'''" button to hide detailed protocol layer information for "'''All'''" packets shown. Each "'''Protocol'''" layer can be ''collapsed'' for a given packet revealing only a summary decode description for that specific protocol. Click on a dial expand icon [[Image:Dialexpand.gif]]to hide detailed information about a specific protocol layer for an individual packet. Click on a dial expand all icon [[Image:Dialexpandall.gif]]to hide detailed information for "'''All'''" protocol layers within an individual packet. Use the "'''Collapse All Protocol Blocks'''" button to hide detailed information for "'''All'''" protocol layers found for each packet shown. | |||
The Frame: "'''2'''" packet has been expanded in the caption below. Both the "'''Transport'''" protocol layer: "'''TCP/IP'''" and the "'''Application'''" protocol layer: "'''SSH'''" are also presented in their expanded view. | |||
[[Image:Nst_multi_tap_networking_firewall_packet_details.png|center|frame|Multi-Tap Capture PDML Network Packet Details Decode]] | |||
Each "'''Frame'''" has an associated action link for generating a "'''tshark Display Filter Expression'''" to view that particular packet only. | |||
'''Note:''' Try to limit the number of packets to view when using the "'''Multi-Tap Network Packet Details'''" output format above due to the potential copious amount of '''HTML''' code that can be generated. Use the [<span style="color: blue; font-weight: bold;">Frame Filter</span>] or [<span style="color: blue; font-weight: bold;">Count Filter</span>] action links to help control the number of packets to view. | |||
=== Multi-Tap Capture PDF Decode: NAT/PAT SSH Traffic === | |||
A "'''PDF'''" report including multi-tap capture summary information along with the capture decode can also be produce as shown below. | |||
[[Image:Nst_multi_tap_networking_firewall_pdf.png|center|frame|Multi-Tap Capture PDF Decode]] | |||
'''Note:''' Page setting options for the '''PDF''' output can be controlled within the "'''Global PDF Configuration'''" section found on the NST WUI: "'''Global/Session Configuration Management'''" page. | |||
Latest revision as of 15:21, 16 November 2010
Overview
This section will demonstrate the use of Multi-Tap Network Packet Capture with NST. The NST WUI Network Packet Capture implementation supports simultaneous packet capture on up to 4 network interfaces (Quad Tap) per multi-tap capture session. Multi-segment network packet capture and decode analysis can be performed. NST uses the Wireshark network protocol analyzer suite for network packet capture and decode. Essentially this implementation provides a web-based Packet Sniffer for capturing network traffic and supports the use of up to 4 concurrent network interfaces. Multiple layered protocol decode analysis pages are provided based on both PSML and PDML generated output.
This document was written using v1.5.0 through v2.13.0 release of the NST WUI.
Theory Of Operation
Prior to commencing a multi-tap capture session, each enabled "Network Interface Tap" interface must be associated with a registered network interface on the NST probe. Up to 4 "Tap" interfaces can be enabled. A "Tap" interface is independent of any registered network interface on the NST probe. By assigning a separate network interface to each "Tap", it is possible to perform a network capture as packets flow across a networking device (e.g., router or firewall). One can also associate the same network interface to multiple "Tap" interfaces. This allows one to apply a different "Capture Filter" for the same network interface during packet capture.
A "Capture Data Directory" must also be selected for the resultant merged multi-tap capture file, multi-tap log file and if chosen, the individual tap member capture files. One should consider using a "RAM-based" file system for packet storage while capturing data packets on high traffic network segments. The Linux "RAMFS" or "TMPFS" file systems make excellent choices. The NST WUI provides convenient access for the creation of either one of these file systems during multi-tap capture setup.
The Wireshark light-weight network packet capture tool: "dumpcap" is used as the capture engine. Each enabled "Tap" interface will run a separate "dumpcap" process when the multi-tap capture session is started. Each "dumpcap" process can be configured to have a separate "Capture Filter" and other associated options.
A "Multi-Tap Merge Manager" process is also started when the multi-tap capture session is commenced. The "Multi-Tap Merge Manager" is responsible for monitoring each separate "dumpcap" process during the course of the multi-tap capture session. If any one multi-tap member "dumpcap" process terminates, the "Multi-Tap Merge Manager" will terminate all other "dumpcap" processes associated with the multi-tap capture session. Typically, a termination threshold (i.e. Duration, File Size or Packet Count) that has been satisfied is the usual reason for a "dumpcap" process to terminate. Once all "dumpcap" processes have been terminated, all "Tap" member capture files will then be merged using the Wireshark "mergecap" utility resulting with a multi-tap capture file. Each individual "Tap" member capture file will normally be deleted after the merge by the "Multi-Tap Merge Manager" unless an option was selected to disable removal of these files. A multi-tap capture log file will also be produced by merging all multi-tap member log files. The multi-tap capture log file contains relevant "Tap" member information and identity for historical multi-tap decode analysis.
The NST WUI is session state aware for each attached browser client. This means that each user or multiple users can in many areas of the NST WUI have their own separate configuration and operation. The NST WUI Multi-Tap Network Packet Capture implementation is fully session state capable. Based on this, multiple instances of a multi-tap capture session can occur simultaneously. This type of operation is typically more suited to an enterprise deployment of NST on systems configured with 8 or more network interfaces.
Network Tap
When capturing packets at Gigabit Ethernet rates and one needs total visibility on the link, then a passive network tap is required. Net Optics, a global leader in passive monitoring, makes an excellent 10/100/1000BaseT Tap (TP-CU3) for passively allowing access to monitor GigaBit traffic.
The TP-CU3 tap also allows for full-duplex traffic as if it were in-line (i.e, line rate non-blocking speeds), including Layer 1 and Layer 2 errors to be presented to the NST multi-tap capture interface. Typically a switch mirroring port may drop layer 1 and select layer 2 errors depending on what has been deemed as high priority for that particular switch.
The ntop project has an excellent article on "Port Mirror vs Network Tap" which describes in detail the differences between these two techniques in providing access to network packets.
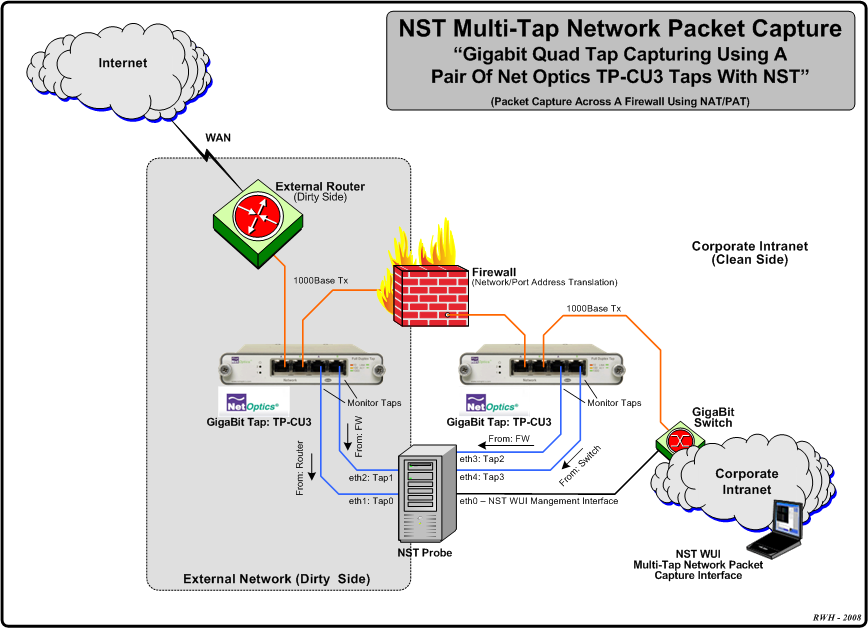
Configuration 1: Multi-Tap Network Packet Capture Across A Firewall - NAT/PAT Traffic
The diagram depicted below shows an example Multi-Tap Capture Setup for monitoring GigaBit traffic across a firewall boundary. One may need to explore the capturing of packets as they transverse the firewall and undergo both Network and Port Address Translation (NAT/PAT).
Configuration 2: Multi-Tap Network Packet Capture - Traffic Between Gigabit Switches
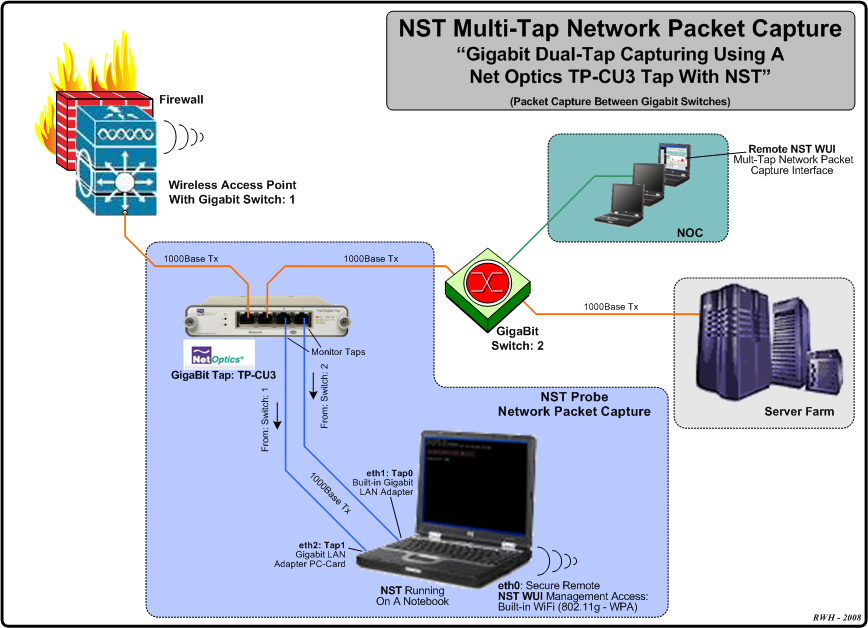
The diagram displayed below shows an example Dual-Tap Capture Setup for monitoring network traffic between 2 Gigabit switches. In this case a generic notebook computer was used and configured with 3 network interfaces (A built-in Gigabit LAN adapter, a Gigabit LAN adapter PC-Card and a built-in 802.11g/n wireless adapter for secure remote access and control of NST).
Example 1: Multi-Tap Network Packet Capture Session Step-By-Step
This section will demonstrate a Multi-Tap Network Packet Capture session using 2 network adapters (eth1 and eth2) as the target capture interfaces. We will concentrate on email traffic (POP and SMTP) occurring on network: "172.28.8.0/24". It is assumed that the NST probe has sufficient network interface adapters (at least 2 in this case) to perform this capture and that these interfaces are attached to a network tap similar to what is shown in the diagrams above or some type of port mirroring (e.g., SPAN - Switched Port Analyzer) configuration.
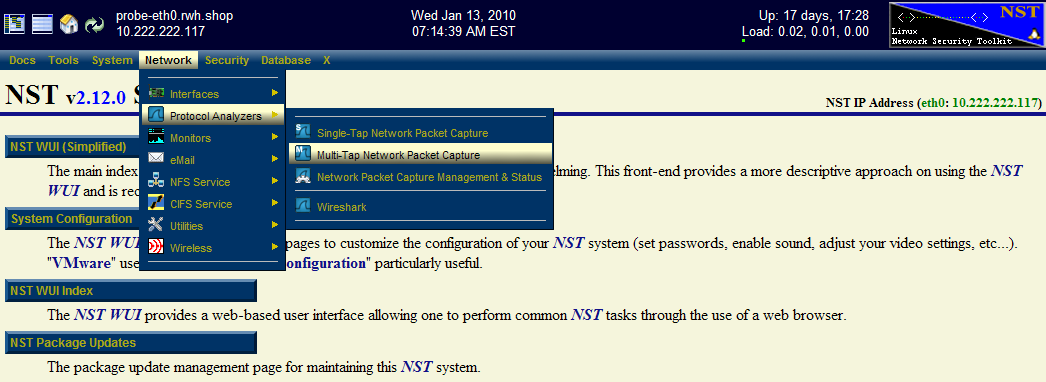
Step: 1 NST WUI Multi-Tap Network Packet Capture Page
From the NST WUI Start page go to the NST WUI Multi-Tap Network Packet Capture page. This is accomplished by using the NST WUI Menu. Go to "Networking" then "Protocol Analyzers" and then go to the "Multi-Tap Network Packet Capture" page as shown below.
Step: 2 Multi-Tap Interfaces & Data Directory Selection
Use the navigational aid link: [Select Tap Interfaces/Directory] to go to the "Multi-Tap Interfaces & Data Directory Selection" section. This is where you select the target capture interfaces and data directory on the NST probe when you will store your multi-tap capture. We will enable Network Interface Taps: "Tap0" and "Tap1" and assign each one to a registered network interface on the NST probe.
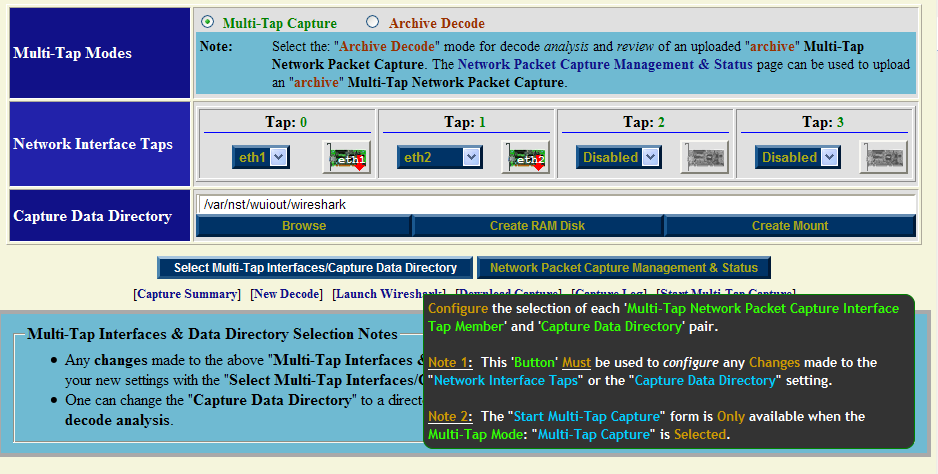
Select interface: "eth1" for Tap0 and select interface: "eth2" for Tap1. For now use the default capture data directory: "/var/nst/wuiout/wireshark". Your configuration should look similar to the NST WUI image caption above. Next select the "Select Multi-Tap Interfaces/Capture Data Directory" button to make your configuration known to NST.
One can also click on a "NIC Adapter" icon to view and control a specific network interface adapter. The caption below shows information for NIC Adapter: "eth2" and results from running the "ethtool eth2" command. Even though the interface state is: "Down", a link has been established and detected on this interface. This is valuable information to know prior to capturing on a particular network interface.
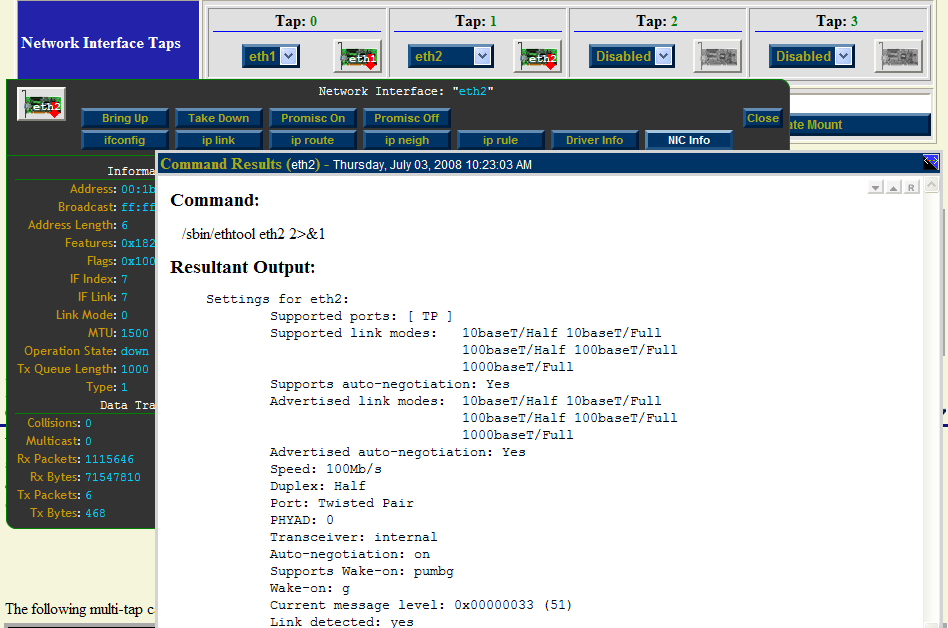
Both interfaces are initially shown in the "Down" state indicated by the red down arrow superimposed on the "NIC Adapter" icons. The network interface will automatically be put in the "Up" state prior to starting a capture session.
Step: 3 Start Multi-Tap Capture Form
After you have selected your "Tap Interfaces" and "Capture Data Directory" next go to the "Start Multi-Tap Capture" section. For this demonstration we will use a "dumpcap" capture filter expression for "POP" and "SMTP" traffic on network: "172.28.8.0/24". Since we selected to use only 2 Taps (Tap0 and Tap1), then only 2 Taps will be dynamically available for configuration out of a possible 4 Taps in the "Start Multi-Tap Capture" form as shown below.
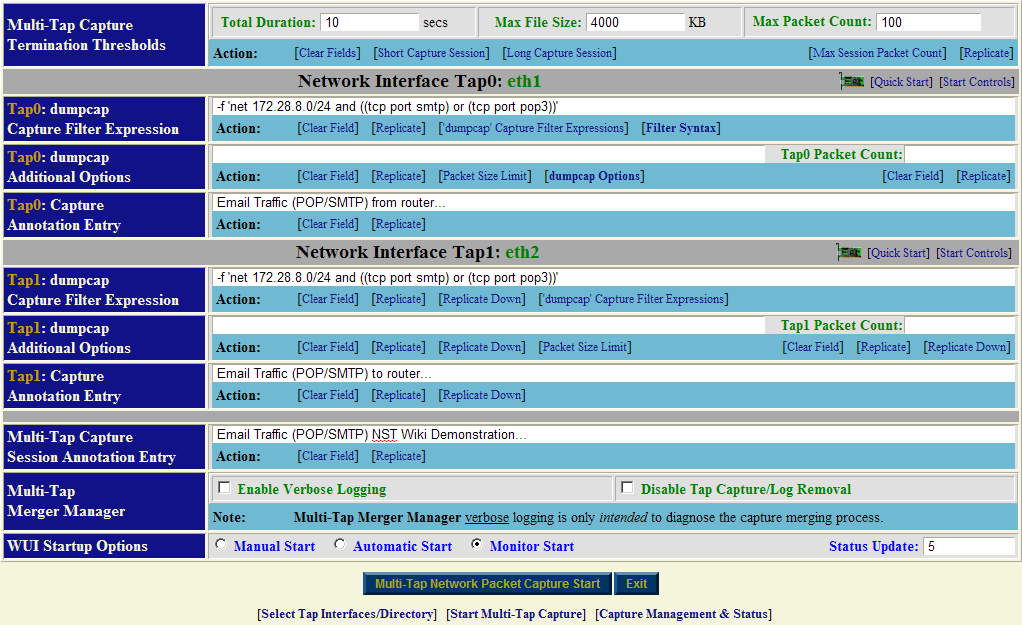
Fill in the form similar to what is shown above. Optionally use the action: ['dumpcap' Capture Filter Expressions] to help fill in the "dumpcap" capture filter expression field for each Tap. Each Tap can have a unique "dumpcap" capture filter expression. Use: "Monitor Start" as one of the "WUI Startup Options". Adjust your capture termination thresholds accordingly. In this case, the capture will terminate automatically when either of the following thresholds have been exceeded: a "10 seconds" capture time has elapsed, a file size of: "4MB" has been reached or "100" network packets have been collected.
Step: 4 Multi-Tap Network Packet Capture Start
Once you are satisfied with values in the "Start Multi-Tap Network Packet Capture" form we will now commence a "Multi-Tap Network Packet Capture" session. Click on the "Multi-Tap Network Packet Capture Start" button to begin the capture session. An automatic sequence of NST WUI Multi-Tap Network Packet Capture pages will now appear until the "Pending Multi-Tap Capture" page that is shown below is reached.

Near real-time dynamic updates using AJAX will occur until one of the termination thresholds is reached. Once termination has been reached, another automatic sequence of NST WUI Multi-Tap Network Packet Capture pages will now appear until the "Multi-Tap Capture Summary" section is now displayed as show below:
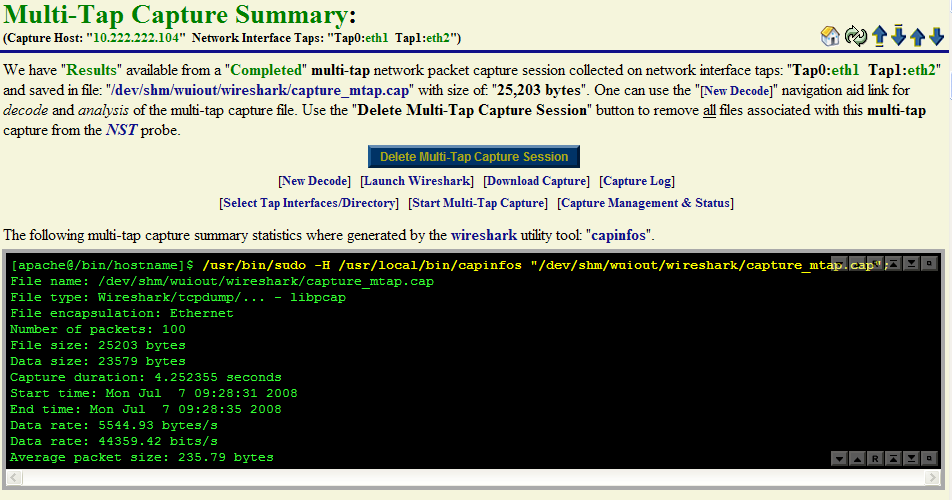
One can see from the Wireshark "capinfos" summary output that the packet count termination threshold of: "100 Packets" caused the capture session to end.
Step: 5 Multi-Tap Network Packet Capture Decode Analysis
At this point we are now ready to perform a decode of the packet capture. Use the [New Decode] navigation aid link to go to the "Multi-Tap Text-Based Protocol Analyzer Decode" section.
Example 2: Multi-Tap Network Packet Capture Across A Firewall Boundary - NAT/PAT Traffic
This example will explore network packet traffic as it flows across a firewall device. We will use a remote "SSH" client request and "SSH" server response for this demonstration and explore the NAT/PAT translation that occurs by decoding the capture. The following diagram shows the network environment for this multi-tap capture. The "SSH" client is located remotely on the Internet using IP Address: 24.97.150.194 and the "SSH" server is NAT/PAT translated using IP Address: 69.205.41.87:22222 its real internal IP Address is: 10.222.222.14:22.
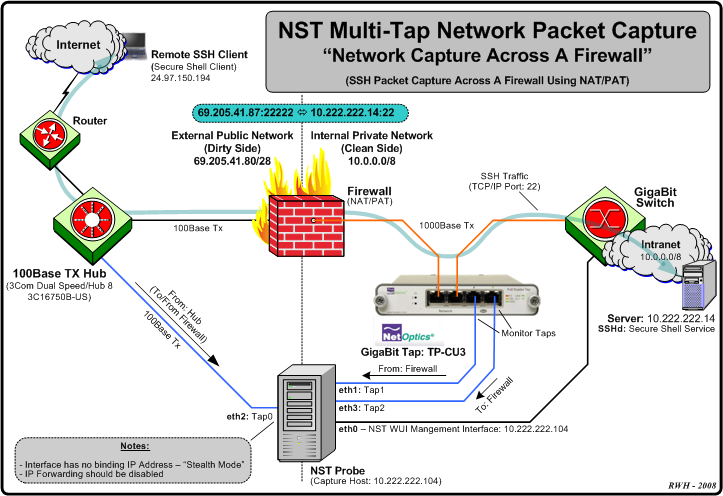
We will be using 3 tap interfaces (Tap0 - 2) for this multi-tap capture. The Hub works in "Half-Duplex" mode and presents both the Transmit and Receive network traffic from the "Dirty" (unfiltered) side of the Firewall device to: "Tap0: eth2". Taps "1" and "2" will be connected to a Net Optics Gigabit copper tap: TP-CU3 for capturing network traffic between the Firewall device and the Gigabit Switch.
Multi-Tap Interfaces & Data Directory Selection Form: NAT/PAT SSH Traffic
Prior to starting up a capture session, each enabled "Network Interface Tap" must be associated with a registered network interface on the NST probe. In this example network interface: "eth2" is assigned to: "Tap0", network interface: "eth1" is assigned to: "Tap1" and network interface: "eth3" is assigned to: "Tap2". Leave "Tap3" Disabled.

A "Capture Data Directory" must also be selected for capture and log file storage. In this case we have chosen directory: "/tmp/pkt/wikidemo". Use the "Select Multi-Tap Interfaces/Capture Data Directory" button to register this configuration with the current Multi-Tap Network Packet Capture session. This will build out the appropriate corresponding "Multi-Tap Start Capture" form which is shown below.
Multi-Tap Network Interface Information (eth2): NAT/PAT SSH Traffic
The "Multi-Tap Interfaces & Data Directory Selection" form also includes network interface action icons allowing one to view specific information and control various properties of a network interface. Dynamic counter values and setting updates will occur periodically via AJAX.
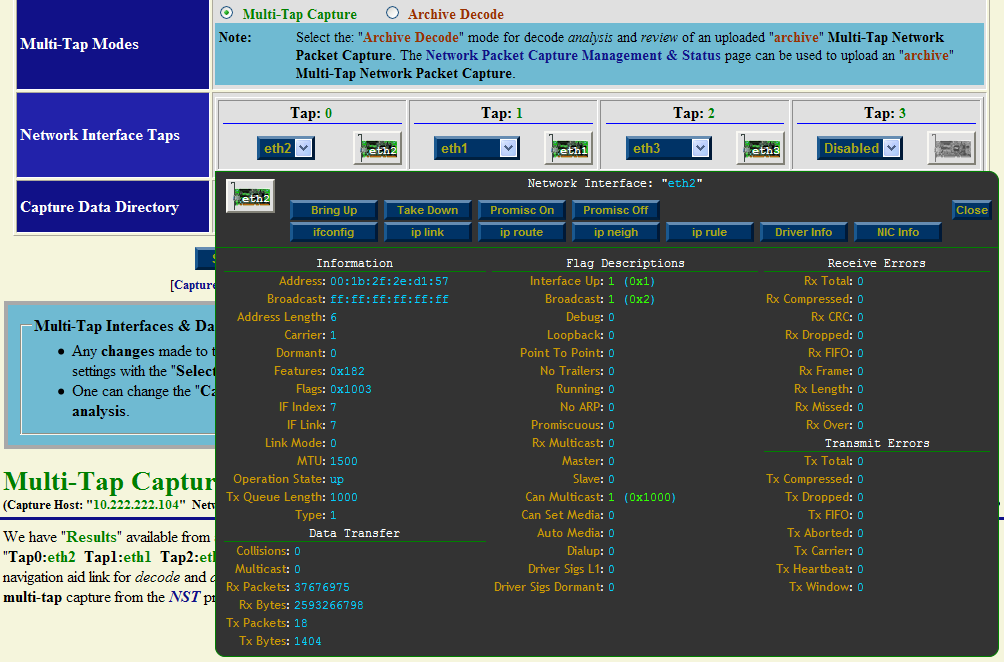
The above view was enabled by clicking on the "eth2" NIC icon. This pop-up view can be dragged around within your browser's window. This is accomplished by first moving your mouse cursor to the top header control area (Note: the cursor icon should change to the "move" icon) and then secondly while holding down the "left" mouse control button the view can be dragged to your desired location.
A pop-up network interface view for each registered network interface can be shown simultaneously. The dynamic update period for counter values and settings can be changed using the parameter value: "Network Interface Information Update Interval" found on the NST WUI: "Global/Session Configuration Management" page section: "DOM Session Configuration".
Multi-Tap Start Capture Form: NAT/PAT SSH Traffic
After registering the enabled "Network Interface Taps" and "Capture Data Directory" above, the "Multi-Tap Start Capture" form should contain input fields for "Tap0", "Tap1" and "Tap2" as shown below. For this example we chose to use a small "Packet Count" termination threshold value of "8 Packets" to control when the multi-tap capture session will end. Once any "dumpcap" process has captured "8 Packets" or more, the entire multi-tap capture session will complete. The other 2 capture termination thresholds: "Duration" and "File Size" will be set to large values and will unlikely be the cause of capture termination. A quick way to set the capture termination thresholds shown is to select the action: [Long Capture Session] and then adjust the "Packet Count" termination threshold to: "8 Packets".
On the public external side a "dumpcap" capture filter expression: -f 'host 69.205.41.87 and (tcp port 22222)' is applied to network interface tap: "tap0:eth2". This filter states that only packets to or from IP Address: "69.205.41.87" And having a source or destination TCP/IP port: "22222" will be captured.
On the private internal side the same "dumpcap" capture filter expression: -f 'host 10.222.222.14 and (tcp port ssh)' is applied to network interface tap: "tap1:eth1" and tap: "tap2:eth3". This filter states that only packets to or from IP Address: "10.222.222.14" And having a source or destination TCP/IP port: "ssh (22)" will be captured.
Hint: A convenient action: ['dumpcap' Capture Filter Expressions] can be used to automate the process of filling in a desired capture filter expression. This action allows one to create, edit, restore, save or load your favorite set of capture filter expressions. The action: [Replicate] can then be used to populated the selected capture filter expression to all other multi-tap member capture filter expression fields.
There are no additional "dumpcap" options used for this example.
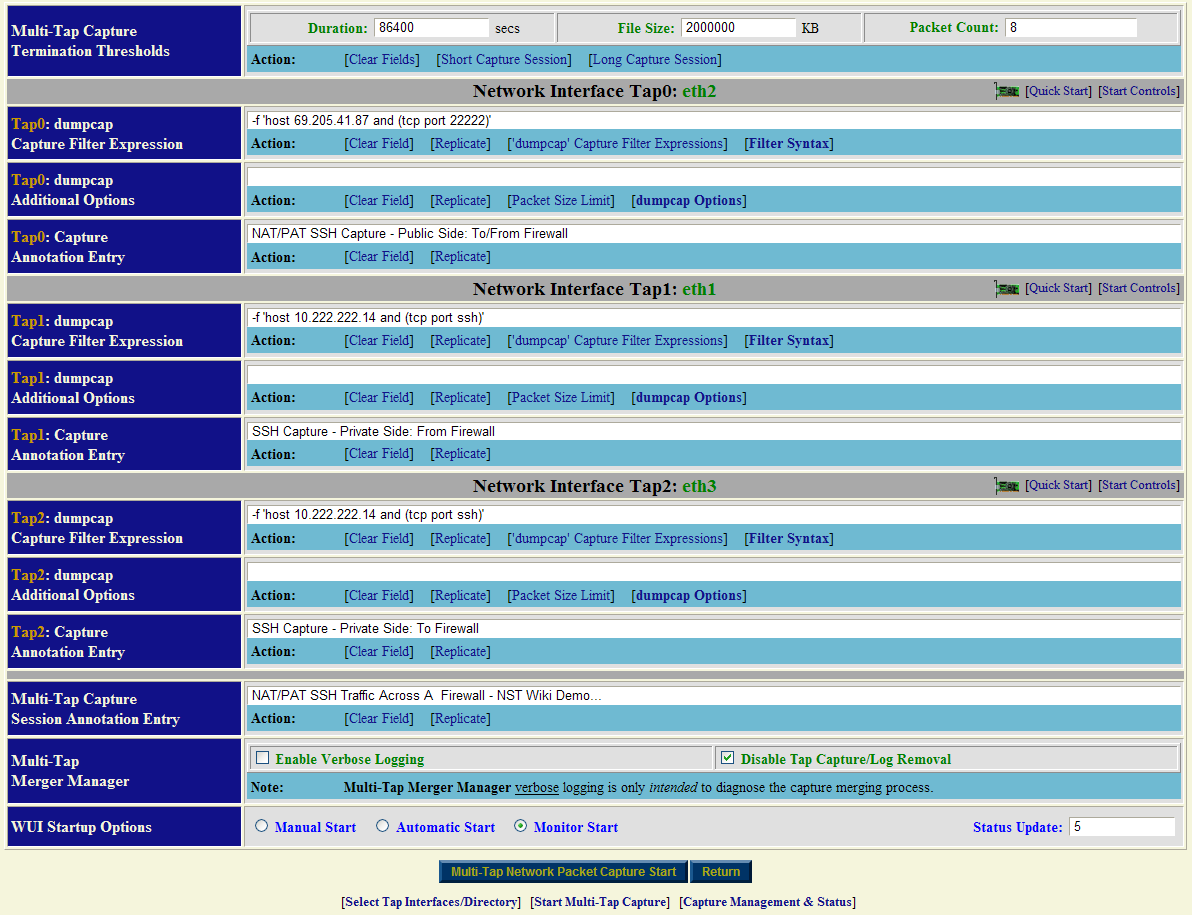
For historical purposes, it is important that one annotates the capture appropriately. Each network tap interface section provides an annotation entry field. There is also a multi-tap capture session annotation entry field. Annotations are very useful and will appear in various tooltip status views throughout the NST WUI Network Packet Capture implementation and can be later searched on using the "Network Packet Capture Management & Status" page.
We have chosen not to remove the individual capture files produced from each "dumpcap" process after the multi-tap capture merge has taken place. This is indicated by the checkbox selection next to the "Disable Tap Capture/Log Removal" text. One may want to retain the individual capture file components as well as the multi-tap capture to perform a rigorous comprehensive decode analysis requiring original data.
The "Monitor Start" option with an update period of "5" seconds has also been selected. This allows for dynamic capture status updates to occur every "5" seconds using AJAX until the multi-tap capture session terminates.
Multi-Tap Pending Capture: NAT/PAT SSH Traffic
The multi-tap network packet capture session is now configured to start. "The Multi-Tap Network Packet Capture Start" button shown above is used to commence the capture. Since the "Monitor Start" option was selected, a series of pages will automatically sequence until the Pending Multi-Tap Capture page appears below. This page will remain active until the packet capture count threshold of "8" packets is reached. Periodic updates occurring every "5" seconds via an AJAX transaction will refresh this page with current capture status information. An SSH "request/response" transaction was initiated on the remote SSH client and was captured for this demonstration.
Each individual tap "dumpcap" command is also shown in its entire form. One may find it convenient to "copy" and "paste" a complete "dumpcap" command for command line usage or to check for proper options passed to a particular "dumpcap" command.
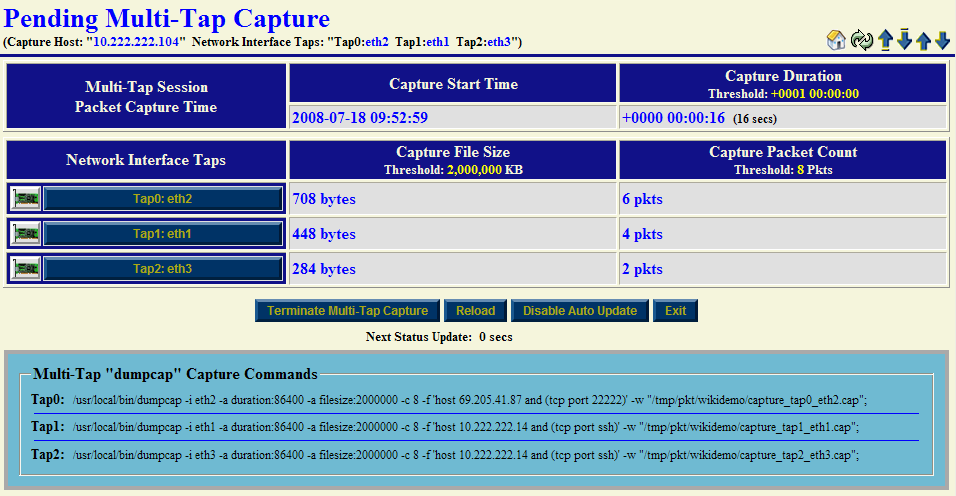
Hint 1: Click on a NIC icon to view network interface information for that capture interface during a real-time multi-tap network packet capture session. One may observe if traffic is being received or not on a network interface even though the capture filter expression in effect is discarding the capturing of these packets.
Hint 2: Click on a Tap interface button (e.g., "Tap2: eth3") to perform decode analysis on the associated "dumpcap" capture file using the NST WUI "Single-Tap Network Packet Capture" implementation. This procedure can occur during a live multi-tap network packet capture session. Use this technique to ascertain if sufficient data has already been captured. If this is the case, one may then terminate the capture session manually.
The "Terminate Multi-Tap Capture" button allows one to manually stop the current multi-tap network packet capture session in progress.
Multi-Tap Capture NST WUI And Capinfos Summary Section: NAT/PAT SSH Traffic
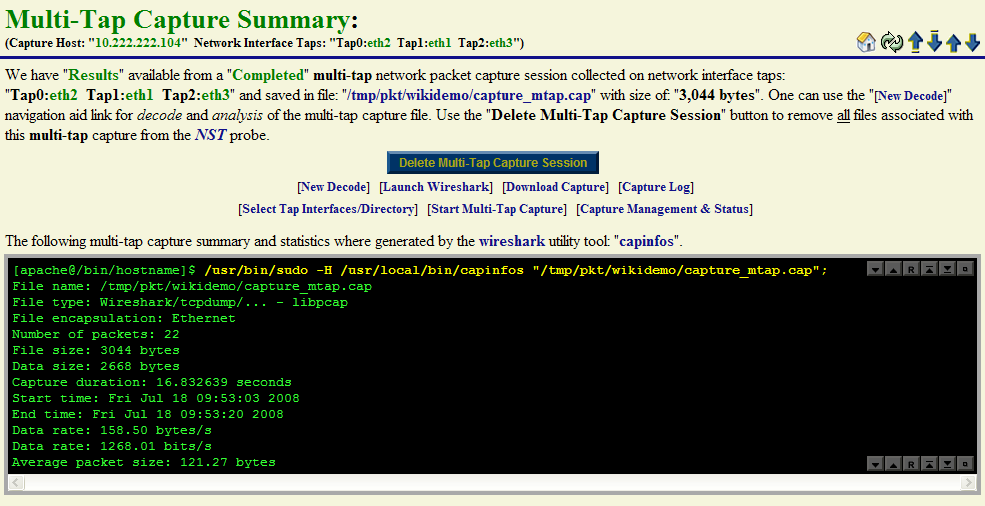
Once a multi-tap network packet capture session has completed, decode and analysis using the multi-tap capture file can be performed. The caption below shows the output from the Wireshark "capinfos" command and NST WUI summary information for the multi-tap capture file: "/tmp/pkt/wikidemo/capture_mtap.cap". This section is initially displayed right after the multi-tap capture session has terminated.
Multi-Tap Capture ToolTip Summary : NAT/PAT SSH Traffic
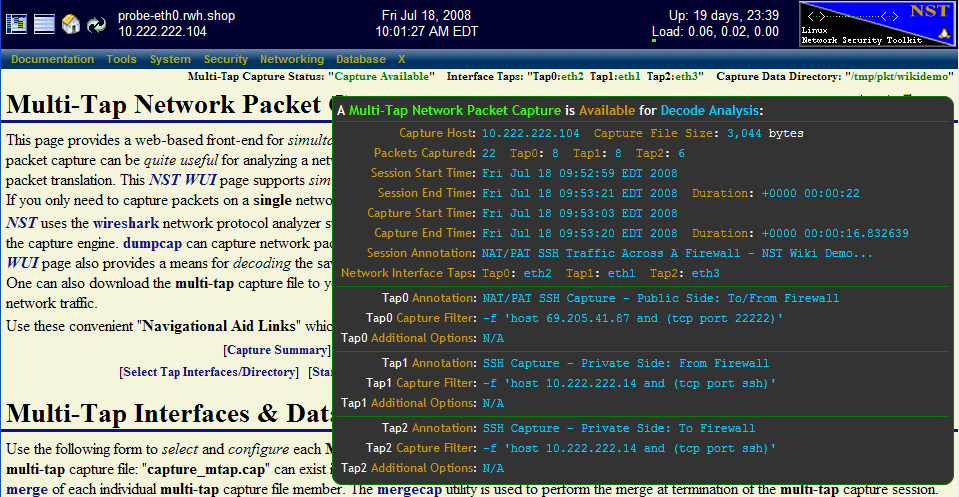
The caption below also shows a summary view of the current multi-tap capture file. One can enable this view by hovering your mouse pointer over the Multi-Tap Capture Status: "Capture Available" header information at the top of the Multi-Tap Network Packet Capture page.
Note 1: The total number of packets captured: "22" was the sum of "8" packets captured on network interface: "Tap0: eth2", "8" packets captured on "Tap1: eth1" and "6" packets captured on "Tap2: eth3".
Note 2: The multi-tap capture termination threshold of "8" packets was reached on both network interface "Tap0" and "Tap1" which caused the capture session to complete.
Note 3: The multi-tap capture session duration is: "+0000 00:00:22" (22 seconds) while the duration between the first and last packet captured is: "+0000 00:00:16.832639" (16.832639 seconds). It is important to distinguish between these two different duration values for capture analysis.
We will now demonstrate various types of decodes and analyses using the multi-tap capture file. Use the [New Decode] navigation link to move to the "Multi-Tap Text-Based Protocol Analyzer Decode" section.
Multi-Tap Capture Decode Form: NAT/PAT SSH Traffic
The NST WUI multi-tap decode section contains many different options, features and ways to decode the capture file. A few different decode scenarios using the multi-tap capture file will be now presented. First time users are encouraged to explore the many different ways that one can decode and view the captured packets. This will help one get a better feel for the NST WUI decode implementation and become more proficient with its use.
Note: For completeness, the "Advanced Decode Protocol Analyzer Options" as shown in the caption below. Typically, these options do not have to be displayed to perform a routine packet decode.
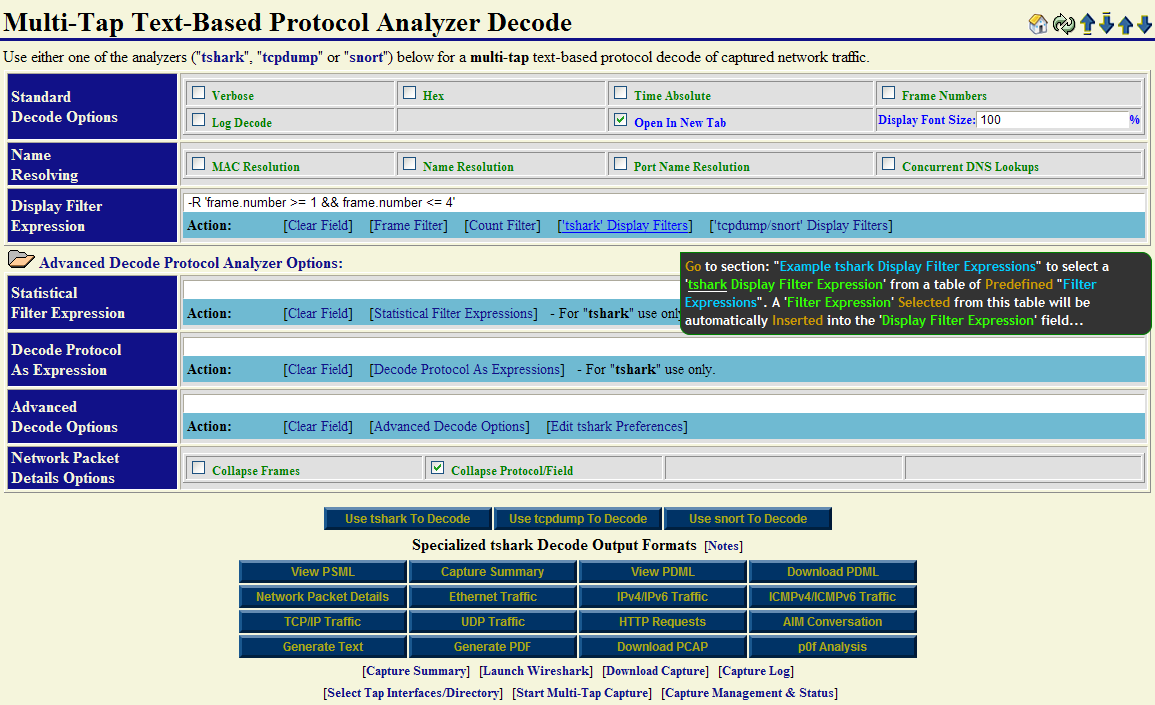
A basic decode using the Wireshark "tshark" command will be shown first to demonstrate the NAT/PAT translation through the Firewall device. The "tshark" display filter expression: -R 'frame.number >= 1 && frame.number <= 4' is used to limit the number of multi-tap captured packets to decode to the first "4" packets in the capture out of a total of "22" packets.
Hint: Use the [Frame Filter] action link as a convenient means for adding an example capture display frame filter: -R 'frame.number >= 1 && frame.number <= 10' to the "Display Filter Expression" field. Modify it accordingly to help limit the size of your decode output.
Multi-Tap Capture Decode Summary: NAT/PAT SSH Traffic
The caption below contains the summary decode that was produced by selecting the "Use tshark To Decode" button. The decode has been labeled and documented for clarity. One can see the occurrence of the inbound NAT/PAT translation through the firewall device for the encrypted SSH "request" with packets: "1" and "2". The outbound NAT/PAT translation occurred through the firewall device for the encrypted SSH "response" with packets: "3" and "4".
With multi-tap network packet capturing, one can derive and quantify the average time packets take to transverse a Layer 3 device (i.e., in this case the Firewall). For this demonstration, on average, 373 microseconds is consumed by the Firewall when passing SSH packets requiring NAT/PAT translation.
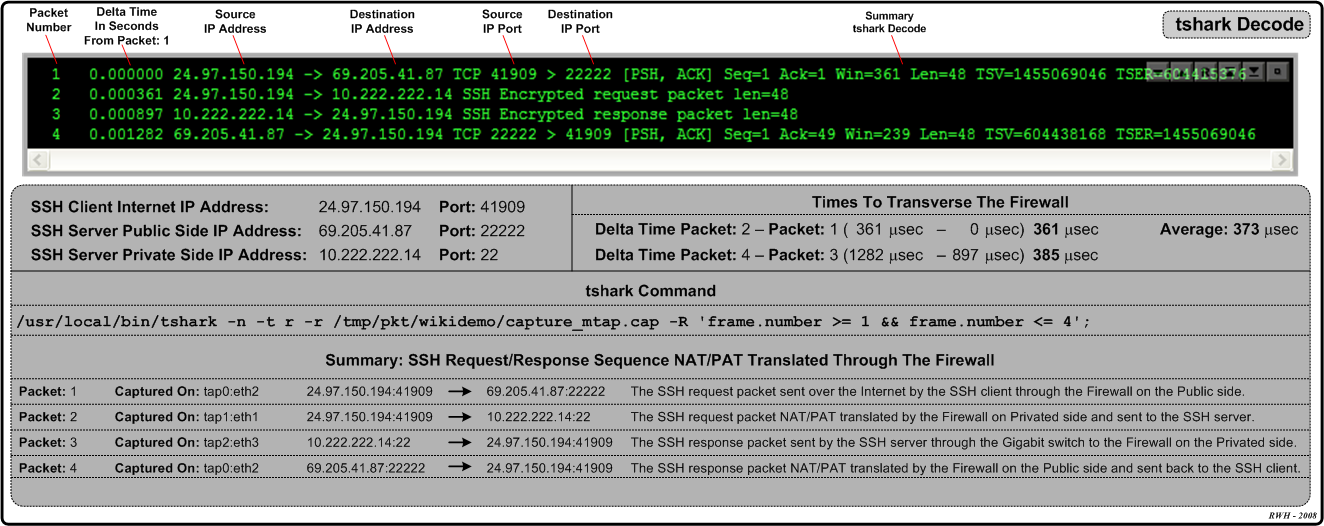
Note: Each packet has been identified by which network interface tap it was "Captured On".
Multi-Tap Capture PDML TCP/IP Decode: NAT/PAT SSH Traffic
There are many different types of "Specialized tshark Decode Output Formats" available with the NST WUI Multi-tap Network Packet Capture implementation. The snapshot below is an NST WUI "TCP/IP" summary view decode output representation derived from a PDML document produced by "tshark". It was generated by selecting the "TCP/IP Traffic" button.
Various capture display filter expressions can be easily created by just clicking on an active table cell. A pop-up tooltip will inform you on what action is available for the particular table cell that your mouse pointer is currently located over. As seen below, a dynamic follow "TCP/IP Stream Display Filter" expression can be generated and used with a new "tshark" decode session by just clicking on the "0x18 (PSH, ACK)" TCP/IP Flags table cell for packet: "4". In this case, if clicked on, a new NST WUI Multi-tap Network Packet Capture page will loaded and populated with this "tshark" capture display filter expression: -R '(ip.addr eq 69.205.41.87 and ip.addr eq 24.97.150.194) and (tcp.port eq 22222 and tcp.port eq 41909)'. This type of display filter is extremely useful when your capture file contains literally thousands of TCP/IP transactions and you need to isolate a particular one.
Note: The "Frame Num" (Frame Number) label is equivalent to "Packet Number".
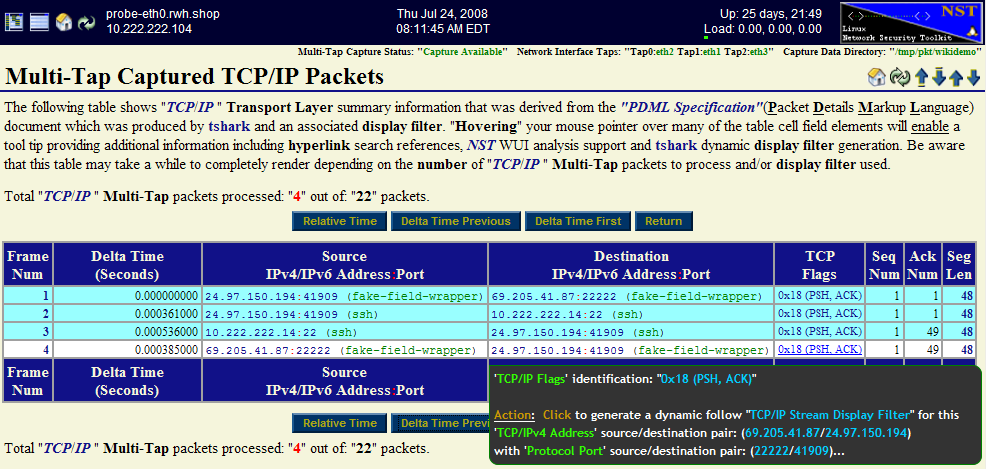
Different time formats for each TCP/IP packet can be displayed and change dynamically using the "Relative Time", "Delta Time Previous" and "Delta Time First" buttons. As shown above, the "Delta Time Previous" button was selected displaying the "Delta Time" in seconds from the "Previous" packet time. The use of this time format reveals the time delay through the Firewall device and is shown for packets: "2" (0.000361000 seconds) and "4" (0.000385000 seconds). From a network perspective, it took the SSH server 0.000536000 seconds to respond to the SSH request.
Multi-Tap Capture PDML Network Packet Details Decode: NAT/PAT SSH Traffic
The following specialized decode output format: "Multi-Tap Network Packet Details" allows one to visualize each network packet in a layered structure format (e.g., Internet Protocol Suite). One can drill down to the bit level to determine the value of a flag setting or an option associated with a specific protocol layer for an individual packet. The ability to "collapse" and "expand" packet and protocol layer information is provided to enhance visibility into the depth of your capture decode.
Expanded Mode: Each "Frame" (Packet) can be expanded detailing information about the protocols found within the packet. Click on a packet folder close icon ![]() to view detailed protocol layer information for an individual packet. Use the "Expand All Frames" button to view detailed protocol layer information for "All" packets shown. Each "Protocol" layer can be expanded for a given packet revealing a detailed decode description for that specific protocol. Click on a dial collapse icon
to view detailed protocol layer information for an individual packet. Use the "Expand All Frames" button to view detailed protocol layer information for "All" packets shown. Each "Protocol" layer can be expanded for a given packet revealing a detailed decode description for that specific protocol. Click on a dial collapse icon ![]() to view detailed information about a specific protocol layer for an individual packet. Click on a dial collapse all icon
to view detailed information about a specific protocol layer for an individual packet. Click on a dial collapse all icon ![]() to view detailed information for "All" protocol layers within an individual packet. Use the "Expand All Protocol Blocks" button to view detailed information for "All" protocol layers found for each packet shown.
to view detailed information for "All" protocol layers within an individual packet. Use the "Expand All Protocol Blocks" button to view detailed information for "All" protocol layers found for each packet shown.
Collapsed Mode: Each "Packet" can be collapsed showing only a summary of the protocols found within the packet. Click on a packet folder open icon ![]() to hide detailed protocol layer information for an individual packet. Use the "Collapse All Frames" button to hide detailed protocol layer information for "All" packets shown. Each "Protocol" layer can be collapsed for a given packet revealing only a summary decode description for that specific protocol. Click on a dial expand icon
to hide detailed protocol layer information for an individual packet. Use the "Collapse All Frames" button to hide detailed protocol layer information for "All" packets shown. Each "Protocol" layer can be collapsed for a given packet revealing only a summary decode description for that specific protocol. Click on a dial expand icon ![]() to hide detailed information about a specific protocol layer for an individual packet. Click on a dial expand all icon
to hide detailed information about a specific protocol layer for an individual packet. Click on a dial expand all icon ![]() to hide detailed information for "All" protocol layers within an individual packet. Use the "Collapse All Protocol Blocks" button to hide detailed information for "All" protocol layers found for each packet shown.
to hide detailed information for "All" protocol layers within an individual packet. Use the "Collapse All Protocol Blocks" button to hide detailed information for "All" protocol layers found for each packet shown.
The Frame: "2" packet has been expanded in the caption below. Both the "Transport" protocol layer: "TCP/IP" and the "Application" protocol layer: "SSH" are also presented in their expanded view.
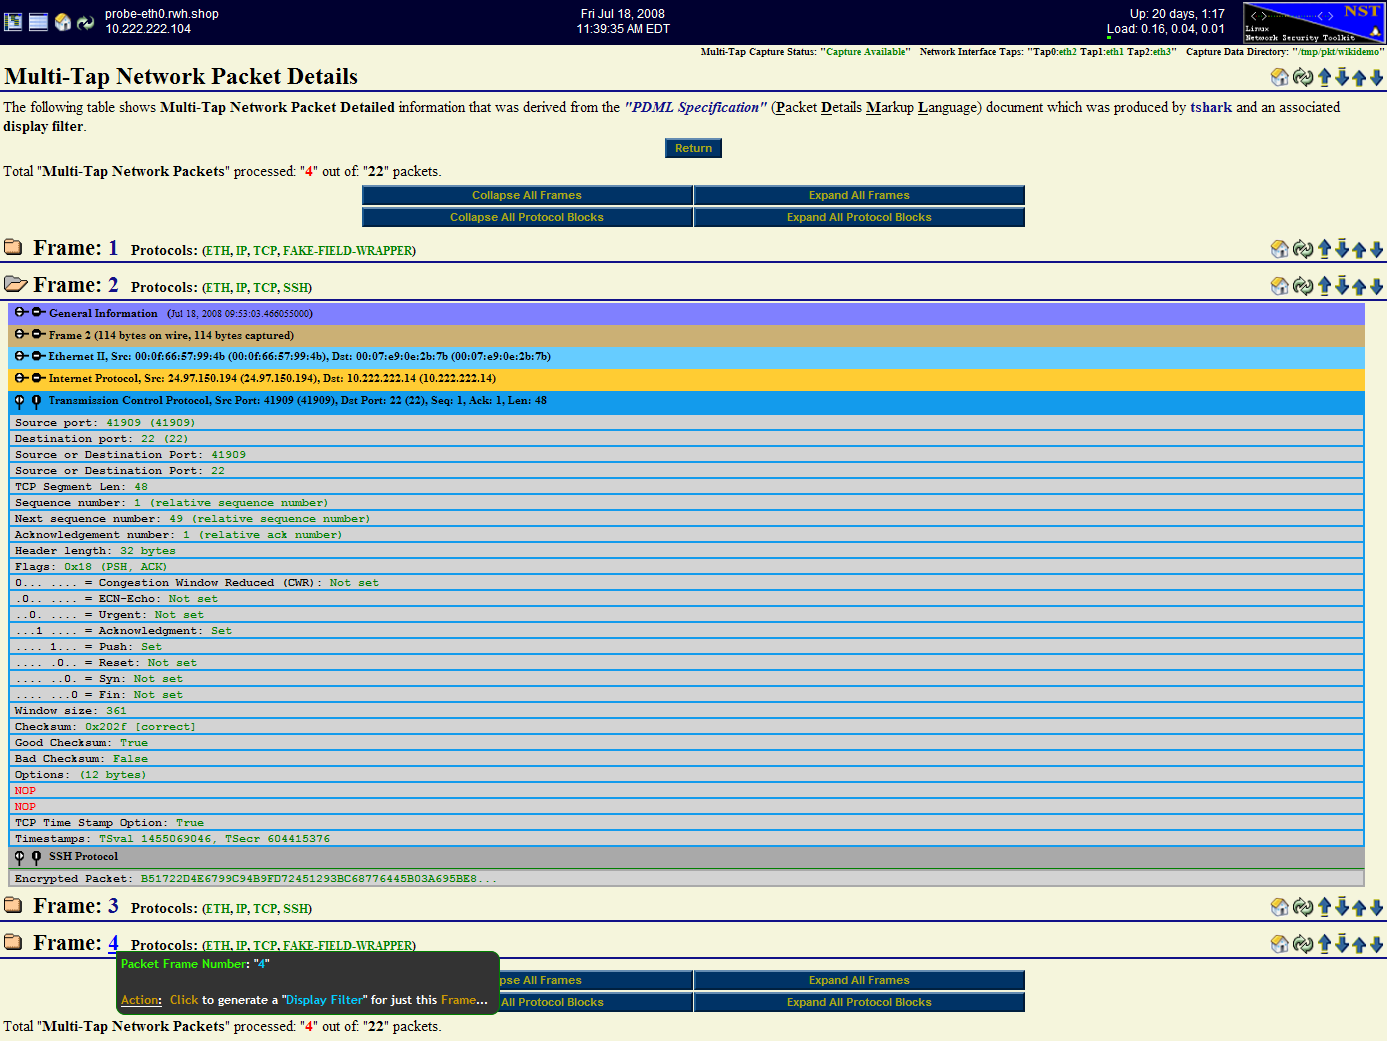
Each "Frame" has an associated action link for generating a "tshark Display Filter Expression" to view that particular packet only.
Note: Try to limit the number of packets to view when using the "Multi-Tap Network Packet Details" output format above due to the potential copious amount of HTML code that can be generated. Use the [Frame Filter] or [Count Filter] action links to help control the number of packets to view.
Multi-Tap Capture PDF Decode: NAT/PAT SSH Traffic
A "PDF" report including multi-tap capture summary information along with the capture decode can also be produce as shown below.
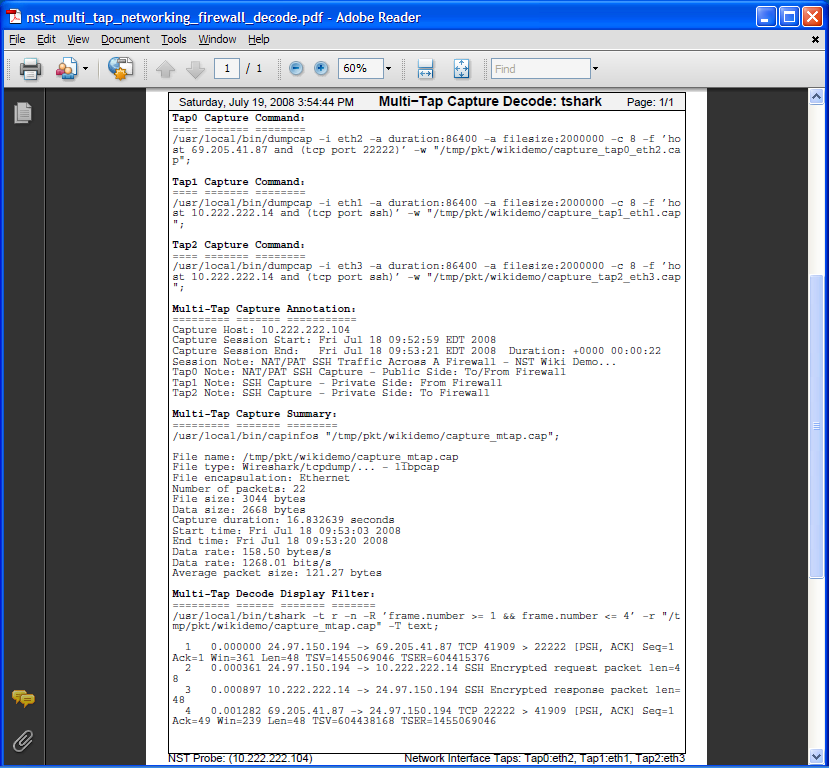
Note: Page setting options for the PDF output can be controlled within the "Global PDF Configuration" section found on the NST WUI: "Global/Session Configuration Management" page.