NST Network Interface Bandwidth Monitor 2: Difference between revisions
| (80 intermediate revisions by the same user not shown) | |||
| Line 4: | Line 4: | ||
The NST Network Interface Bandwidth Monitor 2 is a second generation ''interactive'' dynamic [http://en.wikipedia.org/wiki/Scalable_Vector_Graphics '''SVG''']/[http://en.wikipedia.org/wiki/Ajax_(programming) '''AJAX'''] enabled application integrated into the [[Getting_Started#NST_Web_User_Interface_.28WUI.29 | '''NST''' '''WUI''']] for ''monitoring'' Network Bandwidth usage on each configured network interface in pseudo real-time. | The NST Network Interface Bandwidth Monitor 2 is a second generation ''interactive'' dynamic [http://en.wikipedia.org/wiki/Scalable_Vector_Graphics '''SVG''']/[http://en.wikipedia.org/wiki/Ajax_(programming) '''AJAX'''] enabled application integrated into the [[Getting_Started#NST_Web_User_Interface_.28WUI.29 | '''NST''' '''WUI''']] for ''monitoring'' Network Bandwidth usage on each configured network interface in pseudo real-time. | ||
A use case for the '''Bandwidth Monitor''' can be found in the Wiki article: [[LAN_Ethernet_Maximum_Rates,_Generation,_Capturing_%26_Monitoring | "'''LAN Ethernet Maximum | A use case for the '''Bandwidth Monitor''' can be found in the Wiki article: [[LAN_Ethernet_Maximum_Rates,_Generation,_Capturing_%26_Monitoring | "'''LAN Ethernet Maximum Rates, Generation, Capturing & Monitoring'''"]]. Older information is also available from the ''original'' '''[[NST_Network_Interface_Bandwidth_Monitor | NST Network Interface Bandwidth Monitor]]''' implementation. | ||
[[File:Thunderbolt.png|frame|left|'''[[Feature Release Symbol | <center>NST 2.18.0<br /> SVN: 5413</center>]]''']] | [[File:Thunderbolt.png|frame|left|'''[[Feature Release Symbol | <center>NST 2.18.0<br /> SVN: 5413</center>]]''']] | ||
| | ||
| | ||
| | ||
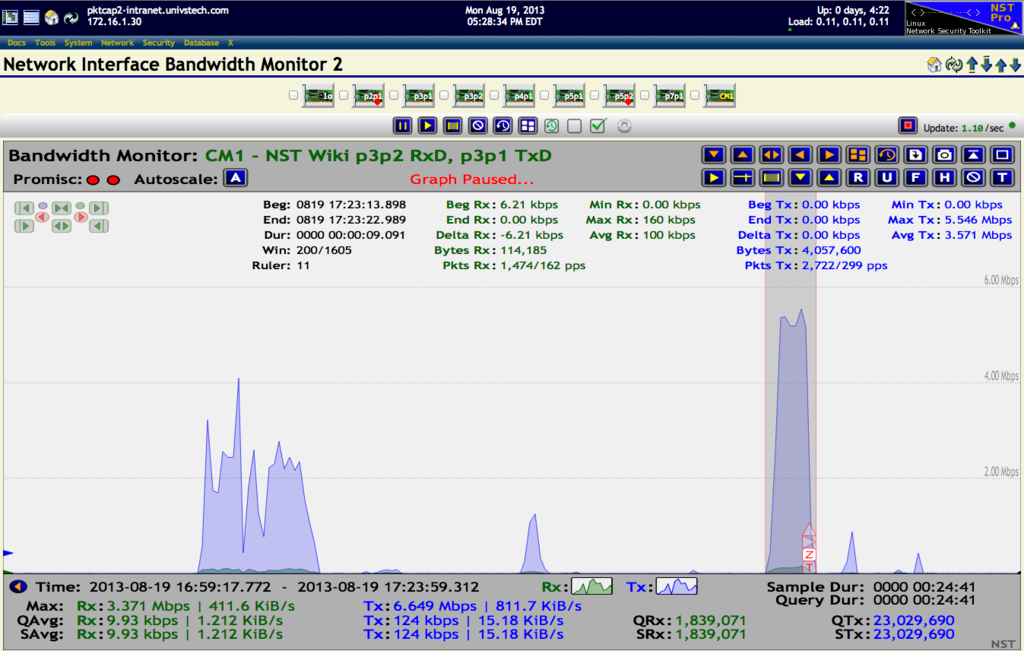
The following '''Bandwidth Monitor''' displays network traffic to and from the '''NST Wiki''' site. A '''[http://www.netoptics.com/products/product_family_details.asp?cid=1&pid=141&Section=products&menuitem=1&tag=NetOptics+Network+Taps TP-CU3]''' Tap is inserted between the '''NST''' probe and the '''NST Wiki''' site providing full-duplex traffic access. A '''Custom Monitor''' was created to display interface traffic on the | The following '''Bandwidth Monitor''' displays network traffic to and from the '''NST Wiki''' site. A '''[http://www.netoptics.com/products/product_family_details.asp?cid=1&pid=141&Section=products&menuitem=1&tag=NetOptics+Network+Taps TP-CU3]''' Tap is inserted between the '''NST''' probe and the '''NST Wiki''' site providing full-duplex traffic access. A '''Custom Monitor''' was created to display interface traffic on the Network TAP's two (2) ''monitoring'' ports: '''p3p2 - RxD''' and '''p3p1 - TxD'''. The '''Ruler Measurement Tool''' is also enabled and focused on a typical '''HTTP''' web page transaction sequence. | ||
[[Image:Nstbwmon2_1.png|1024px|center|Network Interface Bandwidth Monitor 2 - Custom Monitor: CM1 - Interface p3p2 RxD, p3p1 TxD]] | [[Image:Nstbwmon2_1.png|1024px|center|Network Interface Bandwidth Monitor 2 - Custom Monitor: CM1 - Interface p3p2 RxD, p3p1 TxD]] | ||
| Line 52: | Line 39: | ||
== '''Top Monitor Area Controls''' == | == '''Top Monitor Area Controls''' == | ||
The reference diagram below provides a brief description of each '''Top Monitor Area Control''' buttons associated with an '''NST Network Interface Bandwidth Monitor 2 Graph'''. Browser tool tips are also available for each button and notification area providing a descriptive usage dialog. | The reference diagram below provides a brief description of each '''Top Monitor Area Control''' buttons associated with an '''NST Network Interface Bandwidth Monitor 2 Graph'''. '''NST WUI''' and Browser tool tips are also available for each button and notification area providing a descriptive usage dialog. | ||
[[Image:bwmon2_monctrls_1.png|1024px|center|Network Interface Bandwidth Monitor 2 - Top Monitor Area Controls]] | [[Image:bwmon2_monctrls_1.png|1024px|center|Network Interface Bandwidth Monitor 2 - Top Monitor Area Controls]] | ||
A convenient '''Archive & Download''' icon is available to save this Monitor to your client browser system. A '''Snapshot''' icon is also provided for the creation of a "'''Read-Only'''" clone of a Bandwidth Monitor without actually saving the Monitor. One can later archive the '''Snapshot''' Monitor if necessary. See the section on [[#Archive_.26_Threshold_Pause_Snapshots | Archive & Threshold Pause Snapshots]] below. | |||
| | ||
== '''Bottom Monitor Area Controls & Configuration''' == | == '''Bottom Monitor Area Controls & Configuration''' == | ||
The reference diagram below provides a brief description of each '''Bottom Monitor Area | The reference diagram below provides a brief description of each '''Bottom Monitor Area Control & Configuration''' buttons associated with an '''NST Network Interface Bandwidth Monitor 2 Graph'''. '''NST WUI''' and Browser tool tips are also available for each button and notification area providing a descriptive usage dialog. | ||
One can configure the appearance of each Monitor with the '''Bandwidth Monitor Options''' widget. This can be useful to visually distinguish between network segments that are being monitored. | |||
[[Image:bwmon2_bottom_area_1.png|1024px|center|Network Interface Bandwidth Monitor 2 - Bottom Monitor Area Controls & Configuration]] | [[Image:bwmon2_bottom_area_1.png|1024px|center|Network Interface Bandwidth Monitor 2 - Bottom Monitor Area Controls & Configuration]] | ||
| Line 65: | Line 56: | ||
| | ||
== ''' | === '''Archive Graph Monitor''' === | ||
The reference diagram below provides a brief description of | A Bandwidth Monitor can be ''saved'' and later ''[[#Load_Archive_Monitor | loaded]]'' in from the same or a different '''NST''' system to perform historical data rate bandwidth analysis. Use the "'''Download'''" button to save the Monitor to your client browser system. Use the "'''Export'''" button to save the Monitor to the '''NST''' system in directory: "'''/var/nst/bwmon/archive'''". The data is saved in '''CSV''' (Comma Separated Value) format allowing for easy import into most external data analysis applications (e.g., Spreadsheet). | ||
The '''Browse''' button is available for perusing the '''Archive Download''' directory: "'''/var/nst/bwmon/archive'''" with the '''NST WUI Directory Browser'''. | |||
== '''Global Configuration Options Panel''' == | |||
The reference diagram below provides a brief description of the '''Global Configuration Options''' panel for the '''NST Network Interface Bandwidth Monitor 2'''. '''NST WUI''' tool tips are also available for each button, Pull Down menu and Input fields providing a descriptive usage dialog. | |||
The creation of '''Custom Monitors''' and ''loading'' of an '''Archive Bandwidth Monitor''' is done within this options panel. | |||
[[Image:bwmon2_global_conf_1.png|1024px|center|Network Interface Bandwidth Monitor 2 - Global Configuration Options Panel]] | |||
| |||
=== '''Custom Bandwidth Monitor Creation & Usage''' === | |||
One can ''create'' up to Two (2) specialized '''Custom Bandwidth Monitors'''. These monitors allow for combining Network Interface Receive and/or Transmit data stream traffic from ''different'' physical NICs on an NST system into One (1) Bandwidth Monitor utilizing Graphs 1 & 2. An excellent use case for the creation of this type of Monitor is when one wants to combine the monitoring ports on an '''Non-Aggregational Network TAP''' (e.g., '''[http://www.netoptics.com/products/product_family_details.asp?cid=1&pid=141&Section=products&menuitem=1&tag=NetOptics+Network+Taps TP-CU3]''' and '''[http://www.networksecuritytoolkit.org/nstpro/order/dualcomm-multitap-nst-combo.html#usecase4 mTAP-6125]''') to perform bandwidth monitoring (e.g., See the Custom Monitor in the '''[[NST_Network_Interface_Bandwidth_Monitor_2#Overview | Overview]]''' section). | |||
The reference diagram above shows Two (2) ''enabled'' and configured Custom Monitors (i.e., '''CM1''' and '''CM2'''). '''CM1''' is configured using Network Interfaces: "'''p3p2 - RxD'''" and "'''p3p1 - RxD'''" for Graphs 1 & 2 respectively. '''CM2''' is configured using Network Interfaces: "'''p4p1 - RxD'''" and "'''p5p1 - RxD'''" for Graphs 1 & 2 respectively. | |||
=== '''Load Archive Monitor''' === | |||
One can ''load'' in a previously ''saved'' Archive Monitor located on either your client browser system or on the '''NST''' system. Once your have ''typed in'' or '''Browsed''' and ''selected'' an '''Archived Monitor''', then use the appropriate '''Create''' Archive button to ''render'' the Monitor. The '''Create''' button will be renamed to '''ReCreate''' to allow for additional monitor instances. | |||
| |||
== '''Ruler Measurement Tool & Peak Trough Detection Controls''' == | |||
The reference diagram below provides a brief description of the Ruler Measurement Tool Statistics, Resize & Movement Controls and Peak / Trough Detection buttons available with each '''NST Network Interface Bandwidth Monitor 2 Graph'''. Browser tool tips are also available for each button or action providing a more descriptive usage dialog. | |||
The Ruler Tool is handy for time and bandwidth rate analysis. One can navigate the tool by moving the mouse cursor in between the left and right ruler guides and then dragging it accordingly with your mouse device. The left and right ruler guides serve as the start and stop position for the displayed time and bandwidth rate analysis results. When the Ruler Tool is shown, one can also position the tool to the current cursor position by ''clicking'' on the graph. | The Ruler Tool is handy for time and bandwidth rate analysis. One can navigate the tool by moving the mouse cursor in between the left and right ruler guides and then dragging it accordingly with your mouse device. The left and right ruler guides serve as the start and stop position for the displayed time and bandwidth rate analysis results. When the Ruler Tool is shown, one can also position the tool to the current cursor position by ''clicking'' on the graph. | ||
The Peak / Trough Detection | The Peak / Trough Detection button grid is useful for positioning the Left and Right Ruler Tool Guides exactly at a bandwidth data rate peak or trough value to display these data rate values with the Ruler Measurement Tool. | ||
[[Image:bwmon2_rt_ptd_1.png|1024px|center|Network Interface Bandwidth Monitor 2 - Ruler Measurement Tool & Peak Trough Detection]] | [[Image:bwmon2_rt_ptd_1.png|1024px|center|Network Interface Bandwidth Monitor 2 - Ruler Measurement Tool & Peak Trough Detection]] | ||
| Line 82: | Line 98: | ||
[[Image:bwmon2_ch_1.png|1024px|center|NST Network Interface Bandwidth Monitor 2 - Crosshairs Reference Diagram]] | [[Image:bwmon2_ch_1.png|1024px|center|NST Network Interface Bandwidth Monitor 2 - Crosshairs Reference Diagram]] | ||
| |||
== '''Window Average Markers Lines & Statistics''' == | |||
The reference diagram below provides a brief description of the '''Window Average Markers Lines and Statistics''' available with each '''NST Network Interface Bandwidth Monitor Graph'''. The '''Window Average Markers Lines and Statistics''' can be activated by ''clicking'' on either Window Average Marker. Continue ''clicking'' for your desired mode or to hide the lines and statistics altogether. | |||
The average values calculated are for the data rates that are shown in the current graph '''Window''' only. This is different from the average values calculated for the entire '''Sample''' buffer and also the the monitor lifetime '''Query''' average. | |||
This network traffic exhibited in the graph below was generated from initiating a '''[http://en.wikipedia.org/wiki/Verizon_FiOS Verizon FIOS] Movie On-Demand''' ''streaming'' download. One can see that at least "'''4Mbps'''" worth of network bandwidth is consumed by the download. The '''Window Average Markers Lines and Statistics''' provide a useful display for quickly viewing steady-state bandwidth usage. | |||
[[Image:bwmon2_win_avg_1.png|1024px|center|NST Network Interface Bandwidth Monitor 2 - Window Average Markers Lines & Statistics]] | |||
| | ||
| Line 87: | Line 114: | ||
== '''Archive & Threshold Pause Snapshots''' == | == '''Archive & Threshold Pause Snapshots''' == | ||
The Network Interface Bandwidth Monitor 2 application supports the ability to generate a ''Read-Only'' "'''Snapshot'''" clone of the current state of an individual Bandwidth Monitoring Graph. There are two (2) types of Snapshots: "'''Archive'''" or "'''Threshold Pause Archive'''". | The Network Interface Bandwidth Monitor 2 application supports the ability to generate a ''Read-Only'' "'''Snapshot'''" clone of the current state of an individual Bandwidth Monitoring Graph. There are two (2) types of Snapshots: "'''Archive'''" or "'''Threshold Pause Archive'''". | ||
A "'''Snapshot Archive'''" can be useful for historical data rate analysis, data rate differentials or comparison, or to perform a quick data rate measurement without disturbing the present ''pseudo-realtime'' bandwidth monitoring activity. | |||
[[Image:bwmon2_ar_tp_1.png|1024px|center|NST Network Interface Bandwidth Monitor 2 - Archive & Threshold Pause Snapshots]] | [[Image:bwmon2_ar_tp_1.png|1024px|center|NST Network Interface Bandwidth Monitor 2 - Archive & Threshold Pause Snapshots]] | ||
| | ||
= Threshold Pause = | |||
The '''Threshold Pause''' feature allows one to configure an "'''Armed'''" data rate so that if this threshold value is <i>reached</i> or <i>exceeded</i> for a specified duration, one or more '''Bandwidth Monitoring''' graphs will be <i>paused</i> (i.e., A <i>triggered</i> event occurred). This feature closely mimics the armed, threshold and trigger functionality that is found in a standard digital oscilloscope. The '''Threshold Pause''' configuration popup widget is enabled using the "'''T'''" button control. See the '''Threshold Pause Configuration & Controls Reference Diagram''' below for a summary description of each widget component. | |||
[[Image:bwmon2_threspause_conf__ctrls_1.png|1024px|center|NST Network Interface Bandwidth Monitor 2 - Threshold Pause Configuration & Controls Reference Diagram]] | |||
<div class="centerBlock"><div class="noteMessage">'''Note:''' Detailed help information for each "'''Threshold Pause'''" configurable option is included within an associated '''Tool Tip'''.</div></div> | |||
| |||
Each '''Bandwidth Monitoring''' graph has its own '''Threshold Pause Configuration & Controls''' widget. You can set one or simultaneous triggers to occur using the pseudo real-time "'''Receive'''" and "'''Transmit'''" bandwidth data rate values. Specify an "'''Armed Duration'''" in milliseconds to indicate how long the bandwidth data rate must sustain or exceed the "'''Armed'''" data rate value. Once this condition is satisfied, a "'''Trigger'''" | |||
event will occur and all selected "'''Paused NICs'''" will stop <i>updating</i> after the "'''Post Trigger Delay'''" expires. Use the "'''Enable'''" or the "'''Enable & Close'''" button to commence a '''Threshold Pause''' session. | |||
== Threshold Pause State Notification Execs == | |||
One can also enable the ability to run "'''Notification Executables'''" on the NST server side when a '''Threshold Pause''' state change occurs. This allows for a bandwidth rate trigger capability that can be quite useful. As an example, one could initiate a network packet capture when a sustained bandwidth data rate exceeds the "'''Armed'''" data rate or indicate to your '''IDS''' service that a denial-of-service ('''DOS''') attack may be occurring. | |||
All executables located in directory: "'''/etc/nst/notifications/bwmon'''" with file extension: "'''.bwmon'''" will be run. NST comes with two (2) example scripts for '''Threshold Pause''' state change logging and Email notification. These script are located in the notification executable directory: "'''/etc/nst/notifications/bwmon'''". Documentation on the configuration and usage can be found in each script. | |||
Select the "'''Notification Execs'''" check box to enable '''Threshold Pause''' state change executables to be run. A configurable "'''Notification ID'''" can be set to uniquely identify '''Threshold Pause''' sessions between different browsers using the same NST system for bandwidth monitoring. | |||
<div class="centerBlock"><div class="noteMessage">'''Available Theshold Pause State Changes:''' | |||
<hr style="color: black; background-color: black;"> | |||
* Disabled | |||
* Enabled | |||
* Armed | |||
* Triggered | |||
* Paused | |||
* Enabled-Started | |||
* Paused-Enabled | |||
* Armed-Rx-Bypassed | |||
* Armed-Rx-Started | |||
* Armed-Rx-Cleared | |||
* Armed-Tx-Bypassed | |||
* Armed-Tx-Started | |||
* Armed-Tx-Cleared | |||
* Graph-Paused | |||
* Graph-UnPaused | |||
* Graph-Cleared | |||
* Query-Stopped | |||
* Query-Restarted | |||
* Page-Enter | |||
* Page-Exit | |||
</div></div> | |||
Latest revision as of 14:10, 10 December 2013
Overview
The NST Network Interface Bandwidth Monitor 2 is a second generation interactive dynamic SVG/AJAX enabled application integrated into the NST WUI for monitoring Network Bandwidth usage on each configured network interface in pseudo real-time.
A use case for the Bandwidth Monitor can be found in the Wiki article: "LAN Ethernet Maximum Rates, Generation, Capturing & Monitoring". Older information is also available from the original NST Network Interface Bandwidth Monitor implementation.

SVN: 5413
The following Bandwidth Monitor displays network traffic to and from the NST Wiki site. A TP-CU3 Tap is inserted between the NST probe and the NST Wiki site providing full-duplex traffic access. A Custom Monitor was created to display interface traffic on the Network TAP's two (2) monitoring ports: p3p2 - RxD and p3p1 - TxD. The Ruler Measurement Tool is also enabled and focused on a typical HTTP web page transaction sequence.
NST Bandwidth Monitor 2 - Reference Diagram
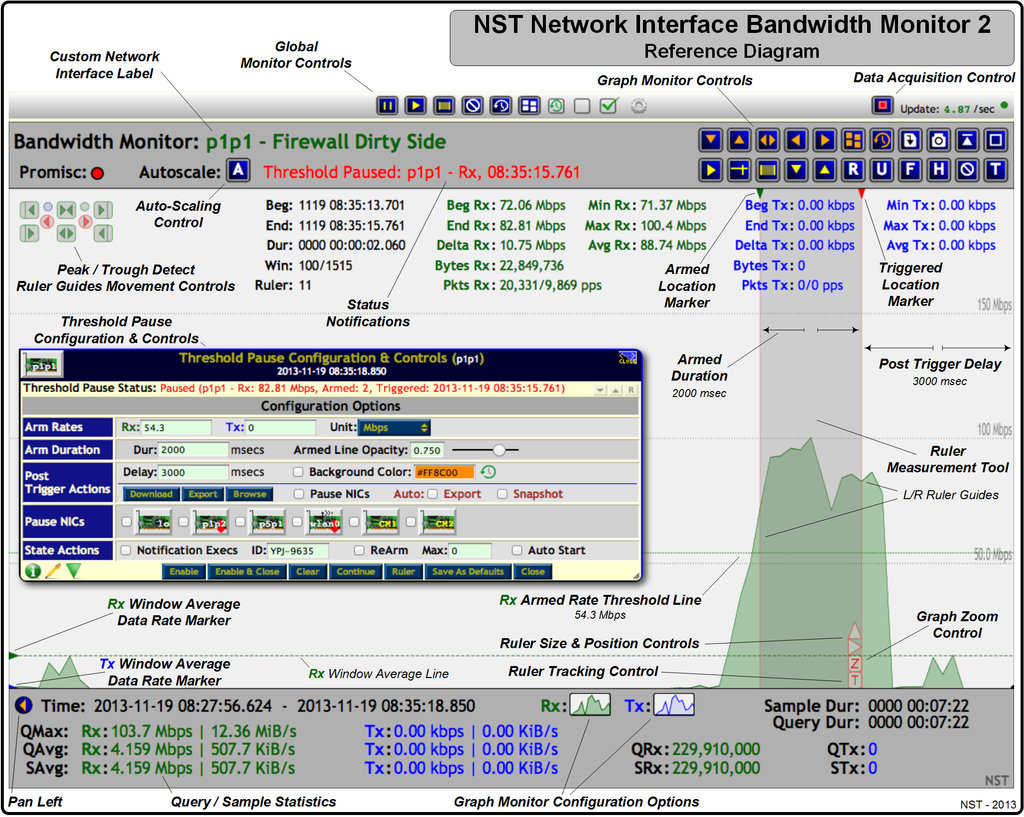
Use this section as a reference for location and description of all controls available with the NST Network Interface Bandwidth 2 Monitors. The image below can serve as a general reference diagram for a single Bandwidth Monitor. Many of the Bandwidth Monitor features have been identified and marked on the image. A Threshold Pause feature that allows "Pausing" of one or more Bandwidth Monitoring graphs when a configured Threshold Armed Rate value is Reached or Exceeded (i.e., Triggered) is also shown. Custom executables can also be run each time a Threshold Pause state change occurs. As an example, one could initiate a network packet capture when a sustained bandwidth data rate exceeds a certain level.
The reference diagram below depicts a Threshold Pause session that was configured on the "p1p1 Bandwidth Monitoring" graph with an Armed Rx bandwidth data rate of: "54.3 Mbps". This bandwidth rate was maintained for the Armed duration of "2000 msecs" as a condition for the Threshold Trigger to occur. A Threshold Trigger event did occur on 2013-11-19 08:35:15.761 at an Rx data rate value of: "82.81 Mbps". A Post Trigger Delay of "3 seconds" was in effect. No additional bandwidth monitoring graphs were set to be Paused. A query rate of "200 msec" was also configured for bandwidth monitor graph updates.
All notification executables located in directory: "/etc/nst/notifications/bwmon" were run at each Threshold Pause state change and marked with ID: "YPJ-9635".
The traffic generated for this example was from a YUM update. A Dualcomm ETAP-3105 TAP was used on the external side of a firewall and presented the network traffic to interface: "p1p1".
Global Monitor Controls
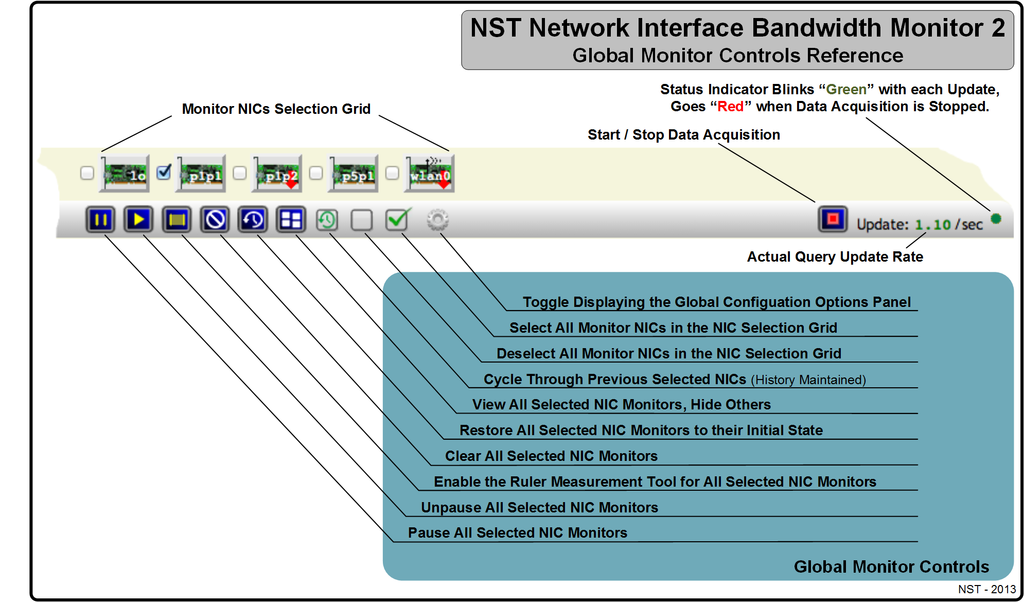
The reference diagram below provides a brief description of each Global Monitor Controls associated with an NST Network Interface Bandwidth Monitor 2. NST WUI tool tips are also available for each Action Icon providing a descriptive usage dialog. Use the "Monitor NIC Selection Grid" with an Action Icon to perform its associated function.
Top Monitor Area Controls
The reference diagram below provides a brief description of each Top Monitor Area Control buttons associated with an NST Network Interface Bandwidth Monitor 2 Graph. NST WUI and Browser tool tips are also available for each button and notification area providing a descriptive usage dialog.
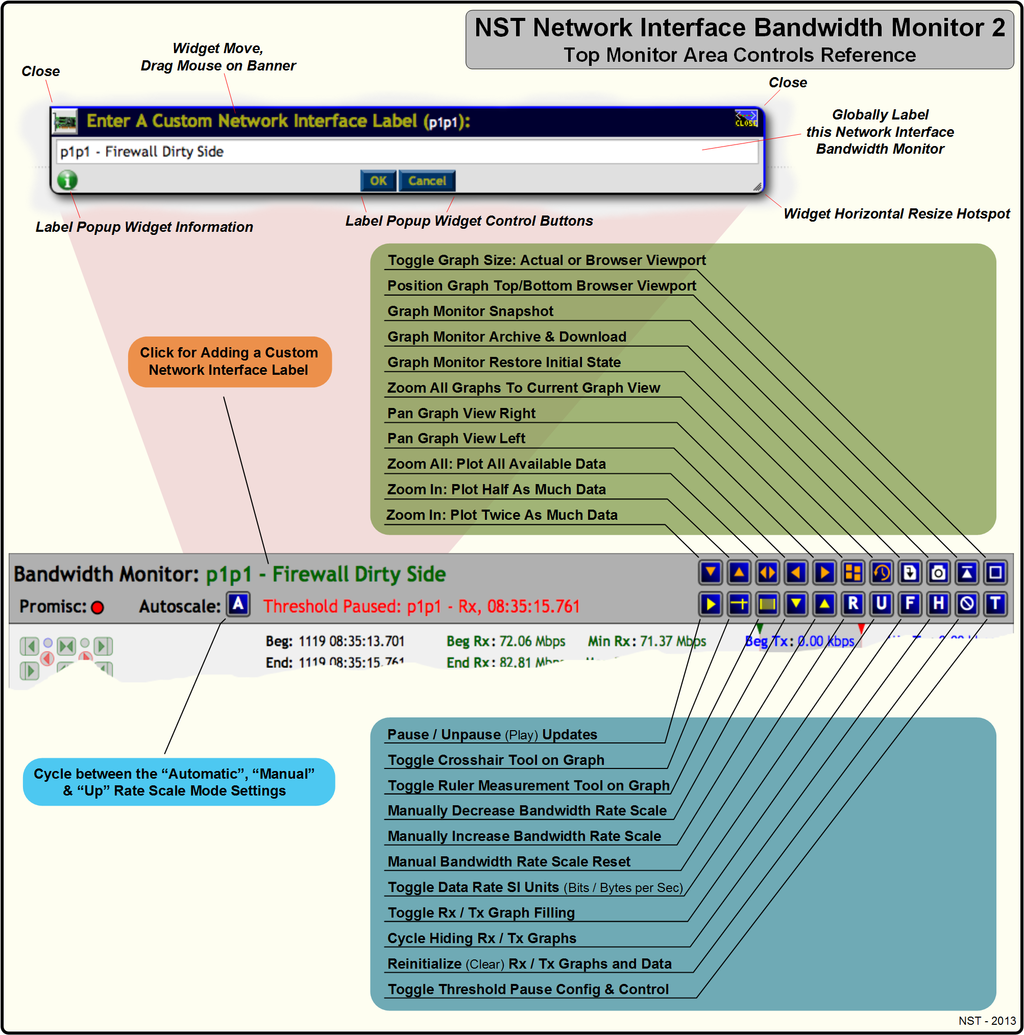
A convenient Archive & Download icon is available to save this Monitor to your client browser system. A Snapshot icon is also provided for the creation of a "Read-Only" clone of a Bandwidth Monitor without actually saving the Monitor. One can later archive the Snapshot Monitor if necessary. See the section on Archive & Threshold Pause Snapshots below.
Bottom Monitor Area Controls & Configuration
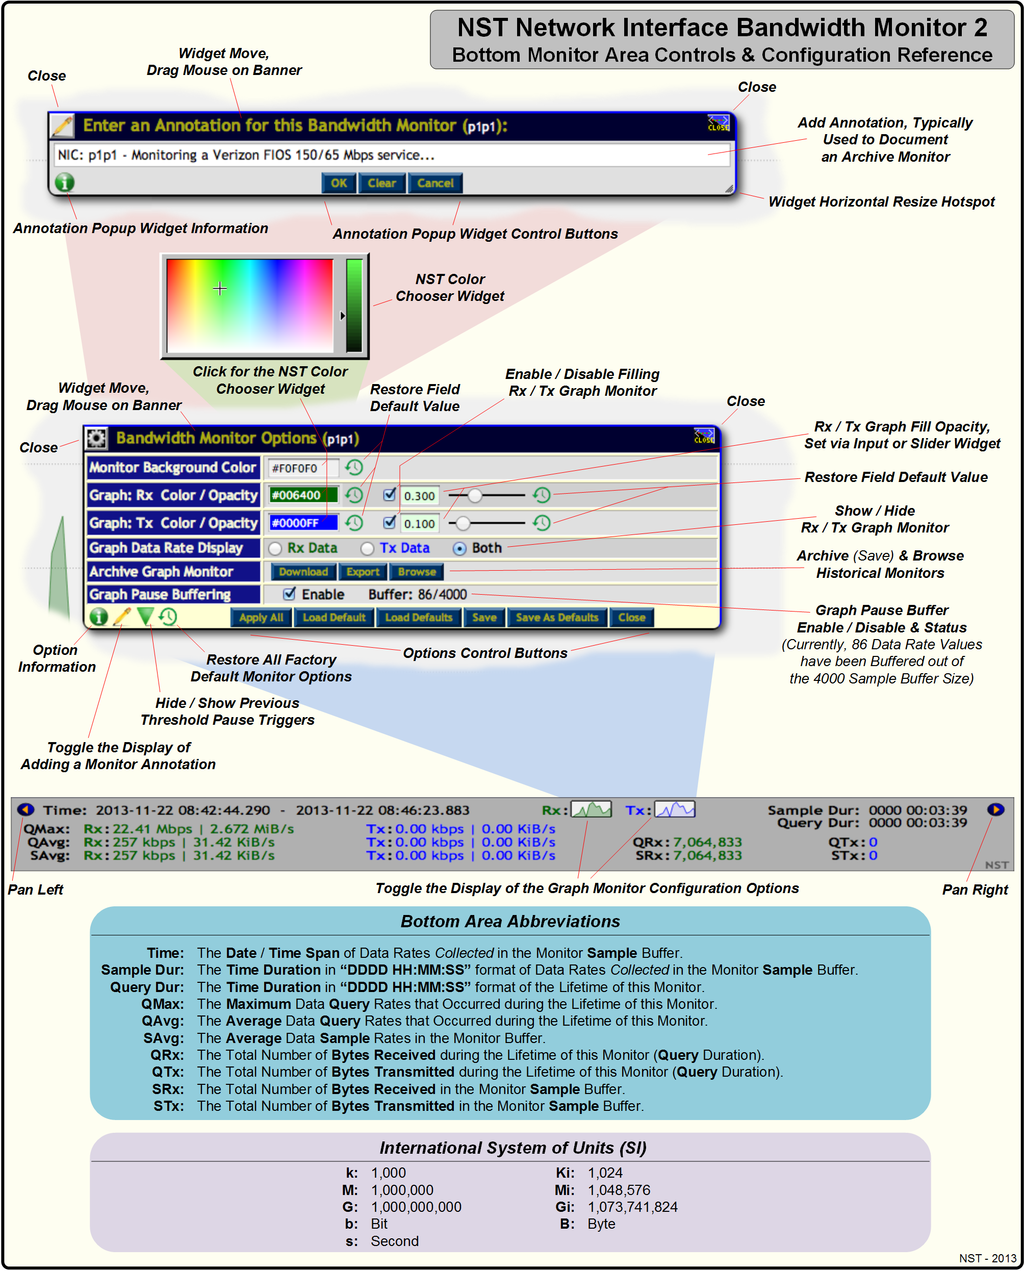
The reference diagram below provides a brief description of each Bottom Monitor Area Control & Configuration buttons associated with an NST Network Interface Bandwidth Monitor 2 Graph. NST WUI and Browser tool tips are also available for each button and notification area providing a descriptive usage dialog.
One can configure the appearance of each Monitor with the Bandwidth Monitor Options widget. This can be useful to visually distinguish between network segments that are being monitored.
Archive Graph Monitor
A Bandwidth Monitor can be saved and later loaded in from the same or a different NST system to perform historical data rate bandwidth analysis. Use the "Download" button to save the Monitor to your client browser system. Use the "Export" button to save the Monitor to the NST system in directory: "/var/nst/bwmon/archive". The data is saved in CSV (Comma Separated Value) format allowing for easy import into most external data analysis applications (e.g., Spreadsheet).
The Browse button is available for perusing the Archive Download directory: "/var/nst/bwmon/archive" with the NST WUI Directory Browser.
Global Configuration Options Panel
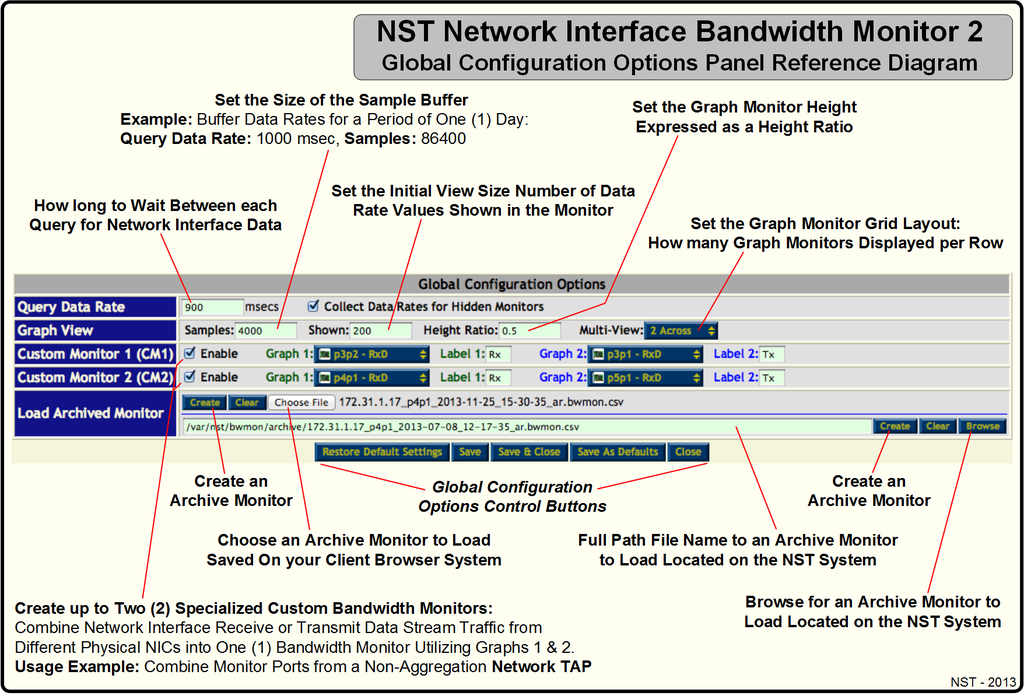
The reference diagram below provides a brief description of the Global Configuration Options panel for the NST Network Interface Bandwidth Monitor 2. NST WUI tool tips are also available for each button, Pull Down menu and Input fields providing a descriptive usage dialog.
The creation of Custom Monitors and loading of an Archive Bandwidth Monitor is done within this options panel.
Custom Bandwidth Monitor Creation & Usage
One can create up to Two (2) specialized Custom Bandwidth Monitors. These monitors allow for combining Network Interface Receive and/or Transmit data stream traffic from different physical NICs on an NST system into One (1) Bandwidth Monitor utilizing Graphs 1 & 2. An excellent use case for the creation of this type of Monitor is when one wants to combine the monitoring ports on an Non-Aggregational Network TAP (e.g., TP-CU3 and mTAP-6125) to perform bandwidth monitoring (e.g., See the Custom Monitor in the Overview section).
The reference diagram above shows Two (2) enabled and configured Custom Monitors (i.e., CM1 and CM2). CM1 is configured using Network Interfaces: "p3p2 - RxD" and "p3p1 - RxD" for Graphs 1 & 2 respectively. CM2 is configured using Network Interfaces: "p4p1 - RxD" and "p5p1 - RxD" for Graphs 1 & 2 respectively.
Load Archive Monitor
One can load in a previously saved Archive Monitor located on either your client browser system or on the NST system. Once your have typed in or Browsed and selected an Archived Monitor, then use the appropriate Create Archive button to render the Monitor. The Create button will be renamed to ReCreate to allow for additional monitor instances.
Ruler Measurement Tool & Peak Trough Detection Controls
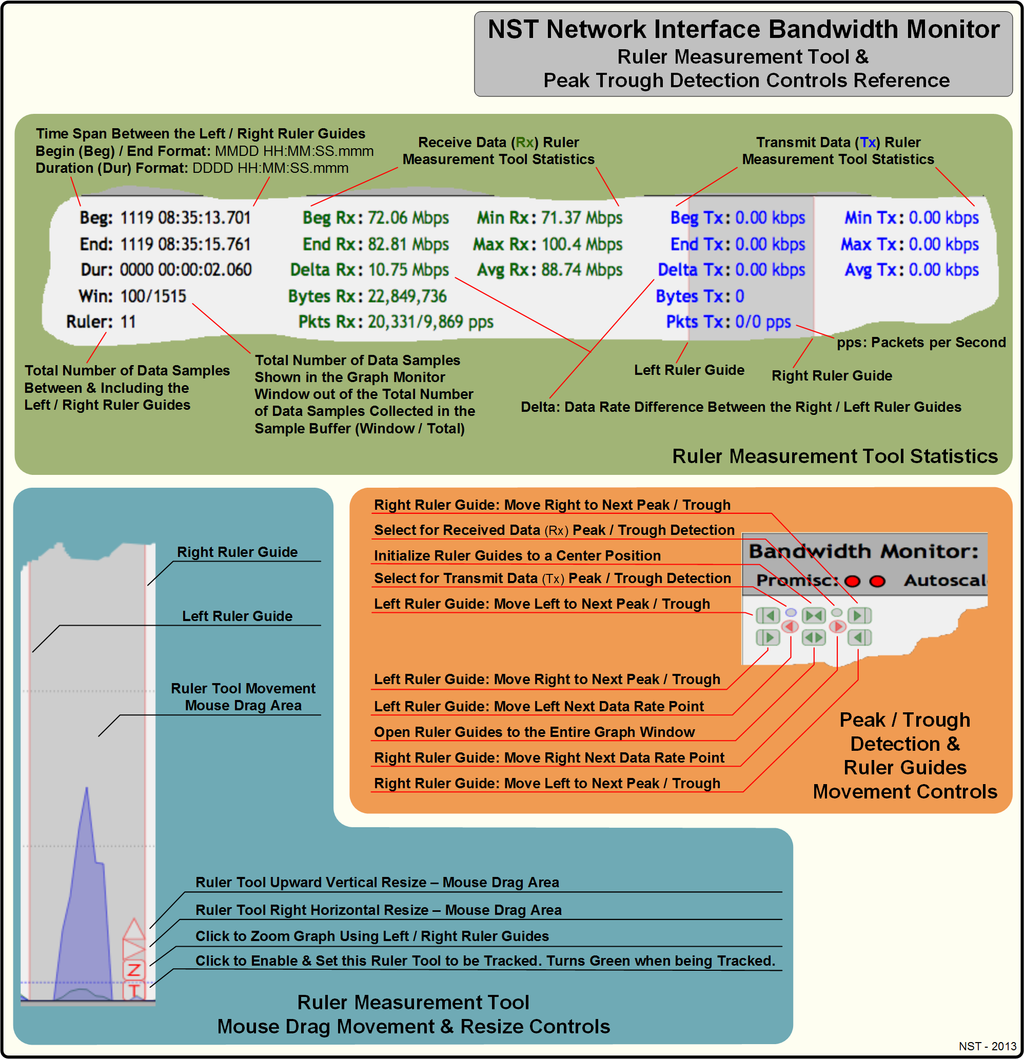
The reference diagram below provides a brief description of the Ruler Measurement Tool Statistics, Resize & Movement Controls and Peak / Trough Detection buttons available with each NST Network Interface Bandwidth Monitor 2 Graph. Browser tool tips are also available for each button or action providing a more descriptive usage dialog.
The Ruler Tool is handy for time and bandwidth rate analysis. One can navigate the tool by moving the mouse cursor in between the left and right ruler guides and then dragging it accordingly with your mouse device. The left and right ruler guides serve as the start and stop position for the displayed time and bandwidth rate analysis results. When the Ruler Tool is shown, one can also position the tool to the current cursor position by clicking on the graph.
The Peak / Trough Detection button grid is useful for positioning the Left and Right Ruler Tool Guides exactly at a bandwidth data rate peak or trough value to display these data rate values with the Ruler Measurement Tool.
Crosshairs Tool
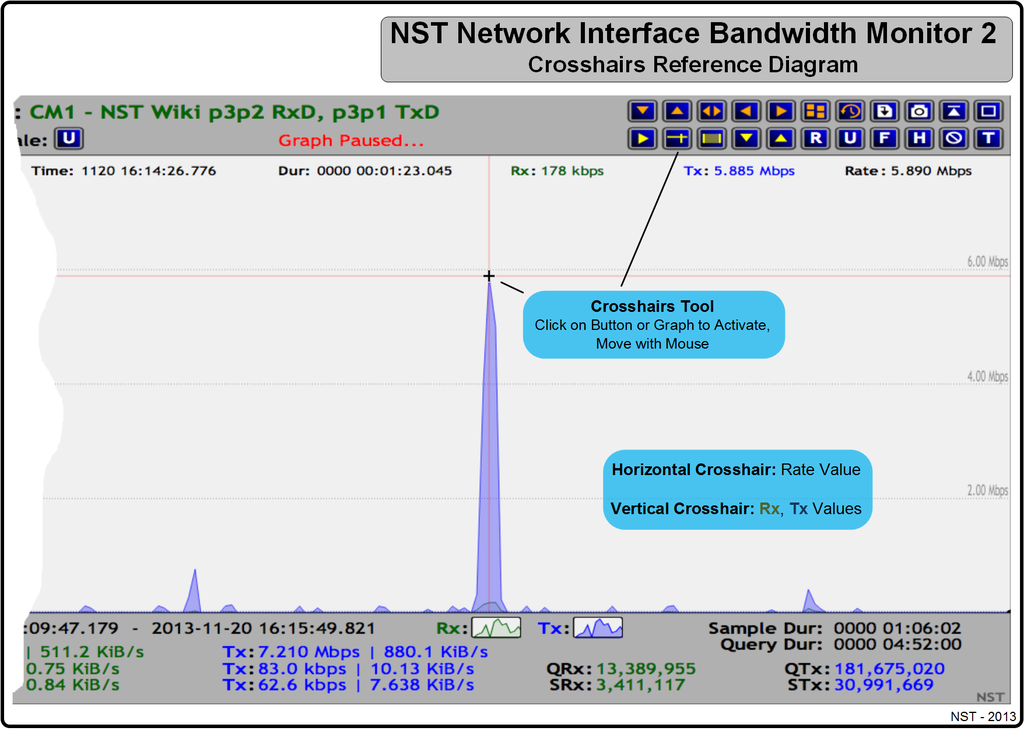
The reference diagram below provides a brief description of the Crosshairs Tool available with each NST Network Interface Bandwidth Monitor Graph. The Crosshairs Tool can be activated by clicking on either the graphing area of a Bandwidth Monitor or using the Crosshairs button.
The Crosshairs Tool displays the data acquisition time, window data duration from the right graph edge or if zoomed in, the from the end of the sample buffer and the data bandwidth rates. The horizontal Crosshair is used to calculate the bandwidth rate for the mouse cursor position and is displayed in black in the upper right hand corner of the graph. The vertical Crosshair is used to calculate the bandwidth rate for both the Receive (Rx) and the Transmit (Tx) data and is displayed in "Green" and "Blue" respectively.
Window Average Markers Lines & Statistics
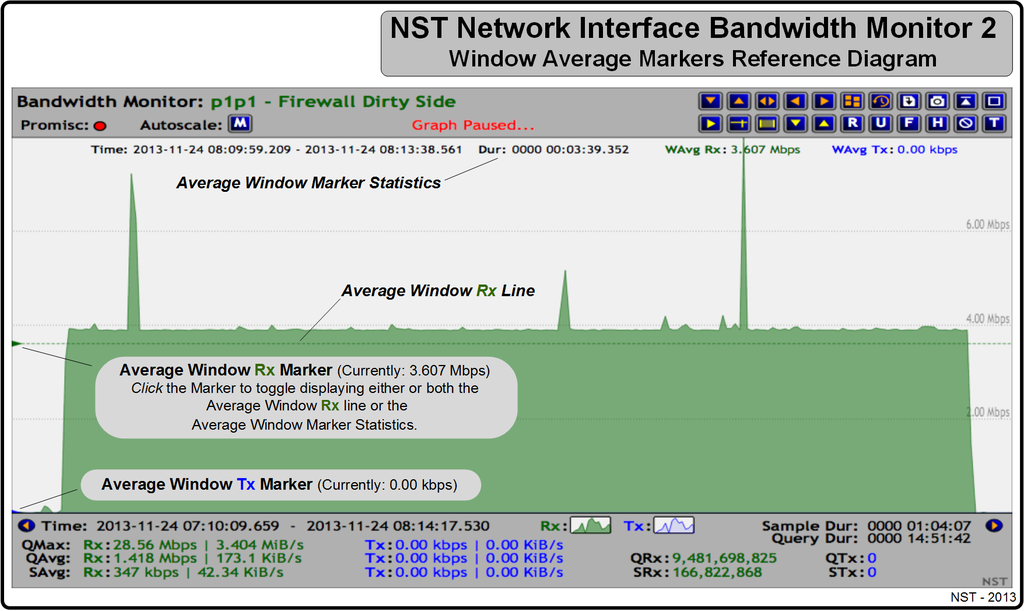
The reference diagram below provides a brief description of the Window Average Markers Lines and Statistics available with each NST Network Interface Bandwidth Monitor Graph. The Window Average Markers Lines and Statistics can be activated by clicking on either Window Average Marker. Continue clicking for your desired mode or to hide the lines and statistics altogether.
The average values calculated are for the data rates that are shown in the current graph Window only. This is different from the average values calculated for the entire Sample buffer and also the the monitor lifetime Query average.
This network traffic exhibited in the graph below was generated from initiating a Verizon FIOS Movie On-Demand streaming download. One can see that at least "4Mbps" worth of network bandwidth is consumed by the download. The Window Average Markers Lines and Statistics provide a useful display for quickly viewing steady-state bandwidth usage.
Archive & Threshold Pause Snapshots
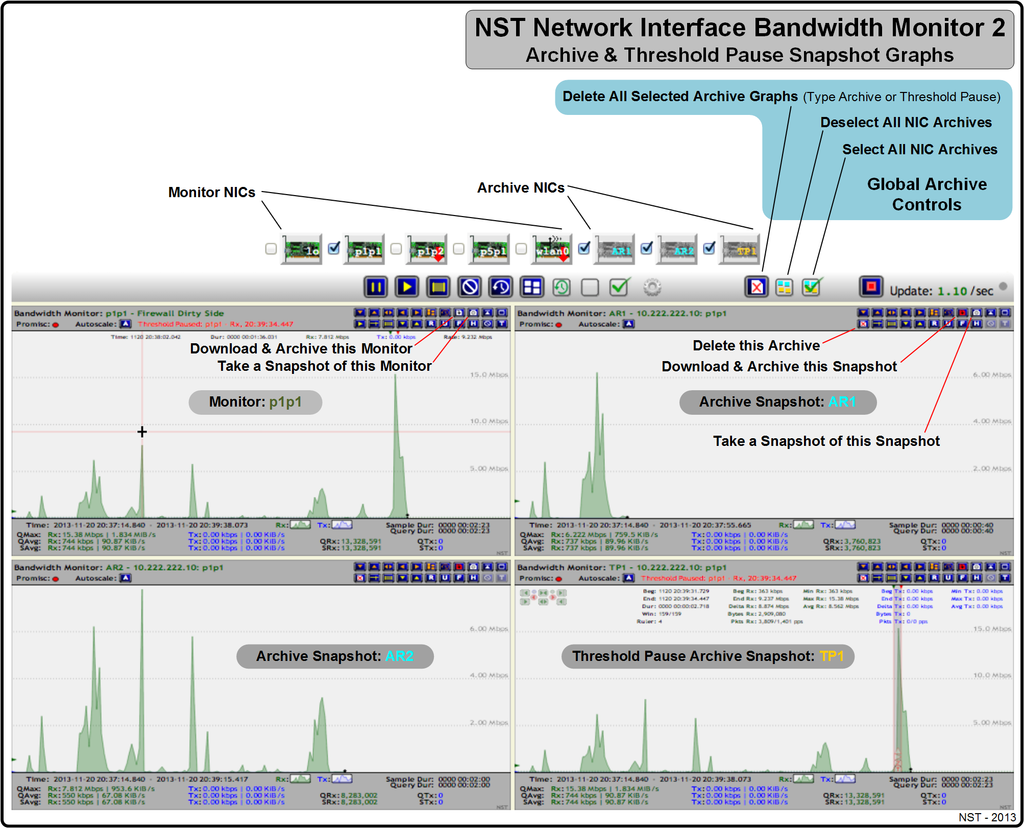
The Network Interface Bandwidth Monitor 2 application supports the ability to generate a Read-Only "Snapshot" clone of the current state of an individual Bandwidth Monitoring Graph. There are two (2) types of Snapshots: "Archive" or "Threshold Pause Archive".
A "Snapshot Archive" can be useful for historical data rate analysis, data rate differentials or comparison, or to perform a quick data rate measurement without disturbing the present pseudo-realtime bandwidth monitoring activity.
Threshold Pause
The Threshold Pause feature allows one to configure an "Armed" data rate so that if this threshold value is reached or exceeded for a specified duration, one or more Bandwidth Monitoring graphs will be paused (i.e., A triggered event occurred). This feature closely mimics the armed, threshold and trigger functionality that is found in a standard digital oscilloscope. The Threshold Pause configuration popup widget is enabled using the "T" button control. See the Threshold Pause Configuration & Controls Reference Diagram below for a summary description of each widget component.
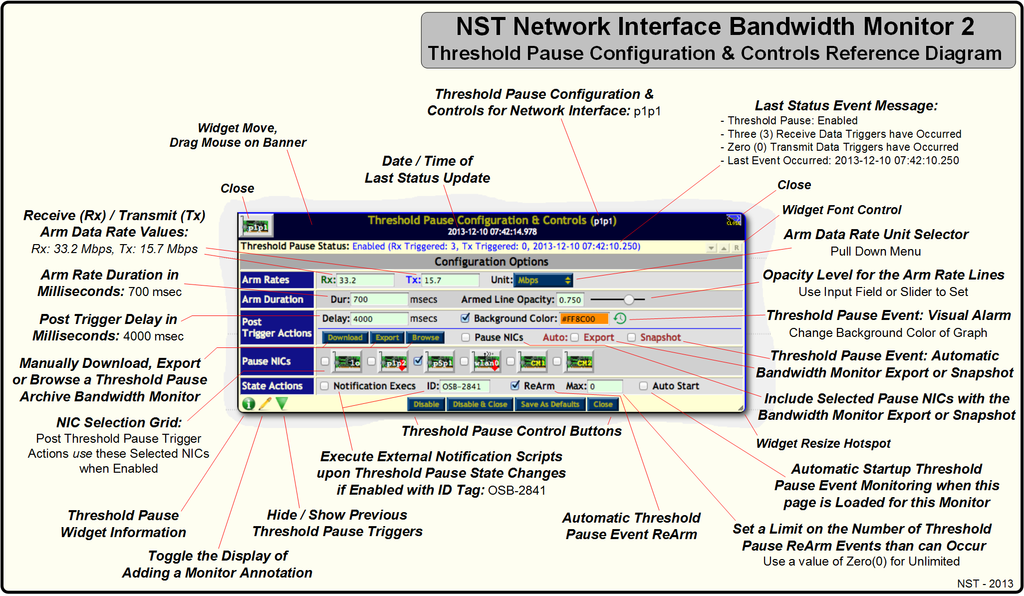
Each Bandwidth Monitoring graph has its own Threshold Pause Configuration & Controls widget. You can set one or simultaneous triggers to occur using the pseudo real-time "Receive" and "Transmit" bandwidth data rate values. Specify an "Armed Duration" in milliseconds to indicate how long the bandwidth data rate must sustain or exceed the "Armed" data rate value. Once this condition is satisfied, a "Trigger" event will occur and all selected "Paused NICs" will stop updating after the "Post Trigger Delay" expires. Use the "Enable" or the "Enable & Close" button to commence a Threshold Pause session.
Threshold Pause State Notification Execs
One can also enable the ability to run "Notification Executables" on the NST server side when a Threshold Pause state change occurs. This allows for a bandwidth rate trigger capability that can be quite useful. As an example, one could initiate a network packet capture when a sustained bandwidth data rate exceeds the "Armed" data rate or indicate to your IDS service that a denial-of-service (DOS) attack may be occurring.
All executables located in directory: "/etc/nst/notifications/bwmon" with file extension: ".bwmon" will be run. NST comes with two (2) example scripts for Threshold Pause state change logging and Email notification. These script are located in the notification executable directory: "/etc/nst/notifications/bwmon". Documentation on the configuration and usage can be found in each script.
Select the "Notification Execs" check box to enable Threshold Pause state change executables to be run. A configurable "Notification ID" can be set to uniquely identify Threshold Pause sessions between different browsers using the same NST system for bandwidth monitoring.
- Disabled
- Enabled
- Armed
- Triggered
- Paused
- Enabled-Started
- Paused-Enabled
- Armed-Rx-Bypassed
- Armed-Rx-Started
- Armed-Rx-Cleared
- Armed-Tx-Bypassed
- Armed-Tx-Started
- Armed-Tx-Cleared
- Graph-Paused
- Graph-UnPaused
- Graph-Cleared
- Query-Stopped
- Query-Restarted
- Page-Enter
- Page-Exit