Difference between revisions of "HowTo Use The Scapy: Multi-Traceroute - MTR"
From NST Wiki
Jump to navigationJump to search (→Scapy: Multi-Traceroute (MTR) Reference Document) |
(→Overview) |
||
| Line 1: | Line 1: | ||
__TOC__ | __TOC__ | ||
= Overview = | = Overview = | ||
| + | [[File:Thunderbolt.png|frame|left|'''[[Feature Release Symbol | <center>NST 22<br /> SVN: 7683</center>]]''']]An NST 22 enhancement now includes a Multi-Taceroute visual using Scapy3k integrated into the '''NST WUI'''. | ||
== Simple Trace == | == Simple Trace == | ||
Revision as of 08:32, 25 March 2016
Contents
Overview
An NST 22 enhancement now includes a Multi-Taceroute visual using Scapy3k integrated into the NST WUI.
Simple Trace
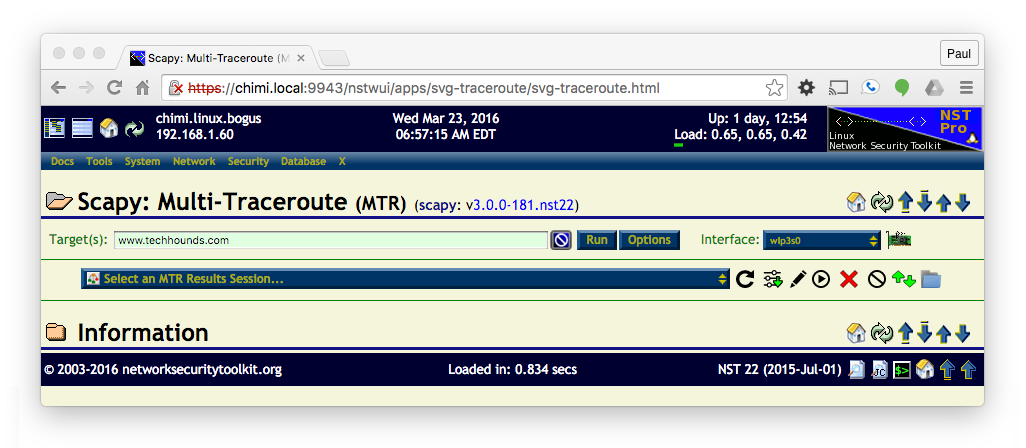
Using the Scapy Multi-Traceroute page can be as simple as entering the host name you want to perform the trace on (www.techhounds.com in the example below) and pressing the Run button.
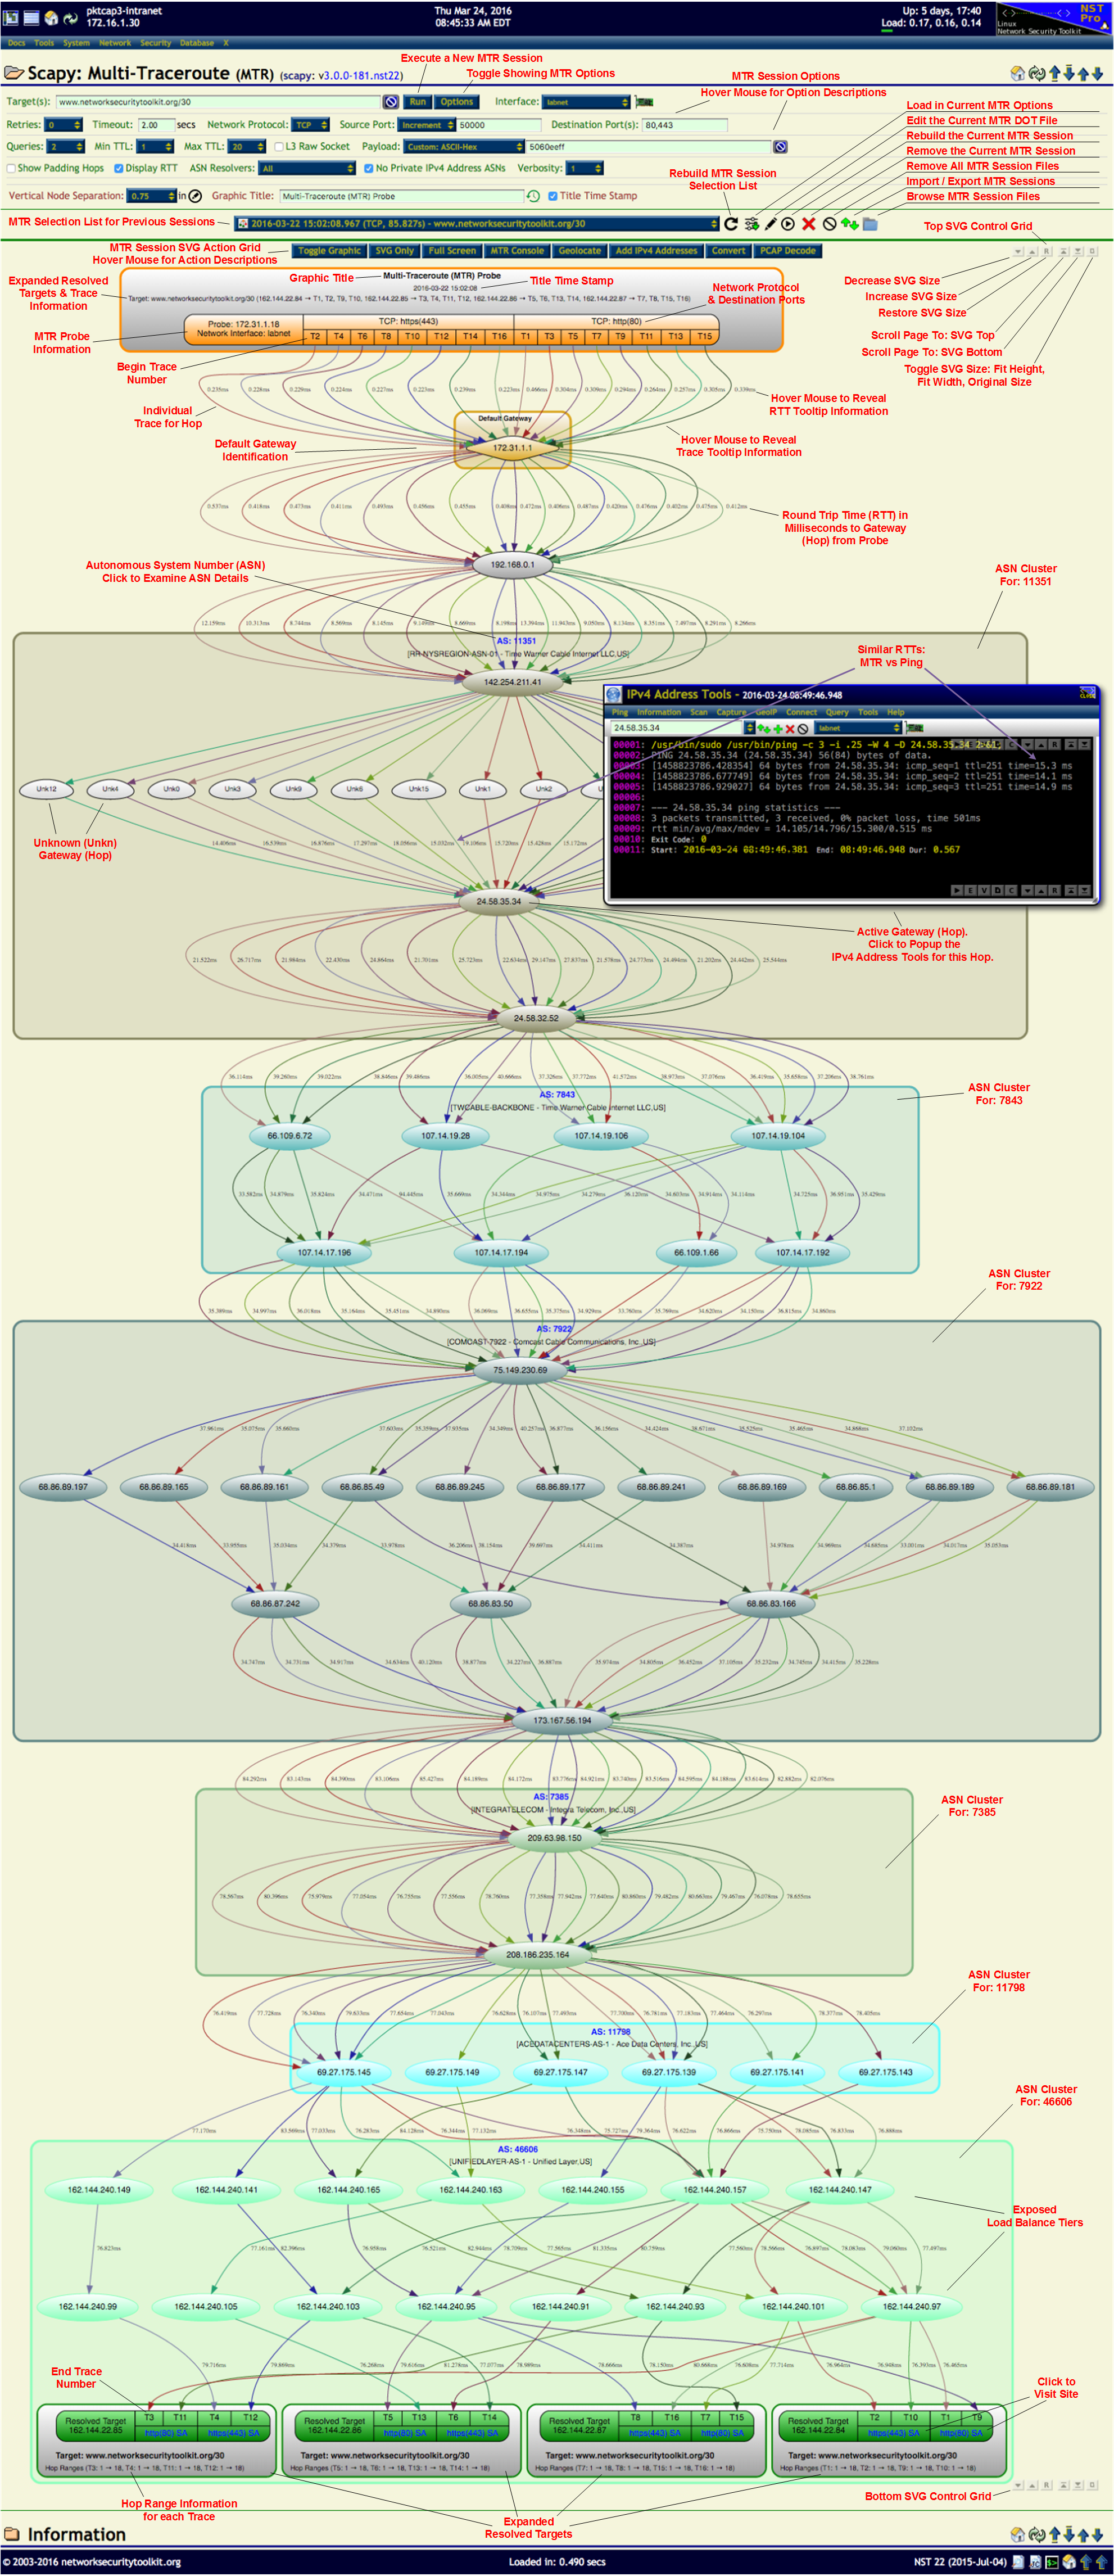
Once the trace completes you will get a graphical chart (as an SVG image shown below) that contains:
- The list of IP addresses exposed by the trace (clicking on an IP address will bring up the IP tools widget).
- Time measurements from the source to each segment of the trace.
- ASN groupings (when possible) of each segment of the trace.
<img src="http://wiki.networksecuritytoolkit.org/nstwiki/images/Scapy-mtr-simple.svg" style="width: 800px" alt="A simple Scapy Multi-Traceroute Example" />
Complex Trace
<img src="http://wiki.networksecuritytoolkit.org/nstwiki/images/Mtr_overview.svg" style="width: 600px" alt="MTR Overview SVG Graphic" />


