Difference between revisions of "HowTo Generate a 3D Pie Chart of nDPI Detected Protocols"
From NST Wiki
Jump to navigationJump to search (→Example) |
(→Overview) |
||
| Line 3: | Line 3: | ||
[[File:Thunderbolt.png|frame|left|'''[[Feature Release Symbol | <center>NST 22<br /> SVN: 7752</center>]]''']]NST enhances the results ''generated'' from the '''[http://www.ntop.org/ndpi/released-ndpi-1-5-1-and-ntopng-1-2-1/ ndpiReader]''' command by visualizing the detected protocols with a 3D Pie Chart proportionally sized by their associated packet size. NST uses code from the '''[http://www.rgraph.net/ RGraph 2D/3D Javascript Charting Project]''' for producing the 3D Pie Chart. The '''ndpiReader''' command leverages '''[http://www.ntop.org ntop's]''' '''[http://www.ntop.org/products/deep-packet-inspection/ndpi/ nDPI (Deep Packet Inspection) Library]''' to analyze a network packet capture. | [[File:Thunderbolt.png|frame|left|'''[[Feature Release Symbol | <center>NST 22<br /> SVN: 7752</center>]]''']]NST enhances the results ''generated'' from the '''[http://www.ntop.org/ndpi/released-ndpi-1-5-1-and-ntopng-1-2-1/ ndpiReader]''' command by visualizing the detected protocols with a 3D Pie Chart proportionally sized by their associated packet size. NST uses code from the '''[http://www.rgraph.net/ RGraph 2D/3D Javascript Charting Project]''' for producing the 3D Pie Chart. The '''ndpiReader''' command leverages '''[http://www.ntop.org ntop's]''' '''[http://www.ntop.org/products/deep-packet-inspection/ndpi/ nDPI (Deep Packet Inspection) Library]''' to analyze a network packet capture. | ||
| − | The '''nDPI Decode''' button found in the decode section of both the '''Single-Tap''' and '''Multi-Tap''' Network Packet Capture pages is used to generate the 3D Pie Chart Capture Analysis. | + | The "'''nDPI Decode'''" button found in the decode section of both the '''Single-Tap''' and '''Multi-Tap''' Network Packet Capture pages is used to generate the 3D Pie Chart Capture Analysis. |
== Reference == | == Reference == | ||
Revision as of 13:49, 22 April 2016
Contents
Overview
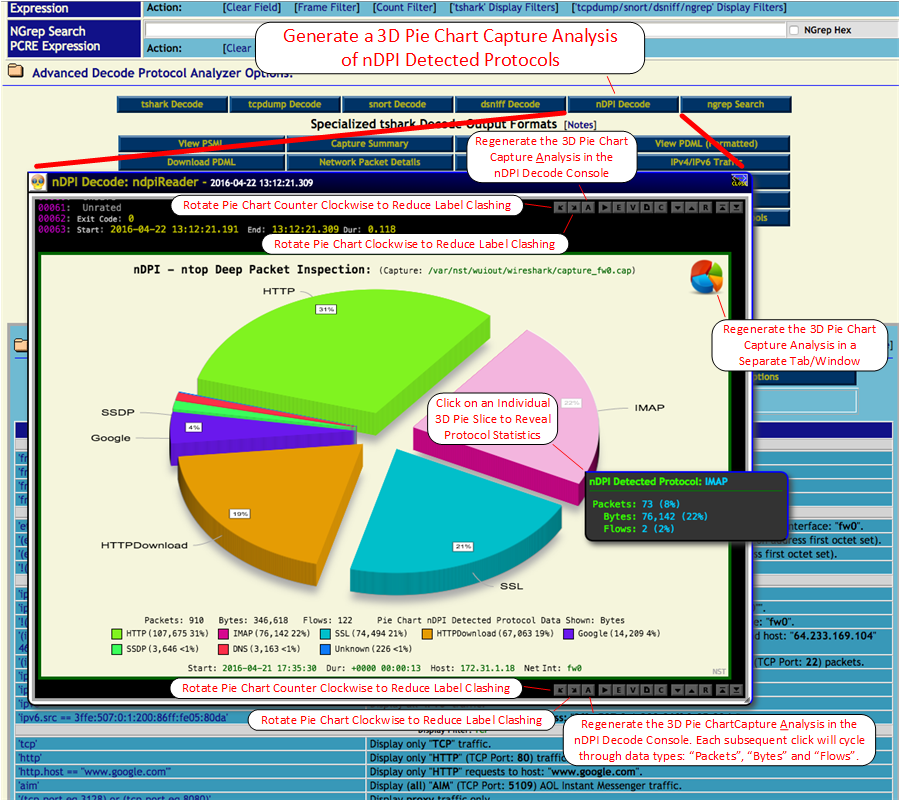
NST enhances the results generated from the ndpiReader command by visualizing the detected protocols with a 3D Pie Chart proportionally sized by their associated packet size. NST uses code from the RGraph 2D/3D Javascript Charting Project for producing the 3D Pie Chart. The ndpiReader command leverages ntop's nDPI (Deep Packet Inspection) Library to analyze a network packet capture.
The "nDPI Decode" button found in the decode section of both the Single-Tap and Multi-Tap Network Packet Capture pages is used to generate the 3D Pie Chart Capture Analysis.
Reference
The image below serves as a reference for the 3D Pie Chart Capture Analysis of nDPI Detected Protocols.

