Overview
Summary
This Wiki offers a means where users of the Network Security Toolkit (NST) can ask questions, share experiences, and offer advice in regards to the use of the NST distribution and the tools which it contains.
The NST homepage is located at: http://www.networksecuritytoolkit.org/. The NST SourceForge project page is located at: http://sourceforge.net/projects/nst. An NST Pro version is located at: http://www.networksecuritytoolkit.org/nstpro. One can download the current version of NST here. A reference about NST at Wikipedia can be found here.
You can view Webcasts related to NST on the NST Screencasts page. This NST Wiki Web site is generated by an "NST 28" system using MediaWiki software running on an Intel NUC. The following are some of the IPv4 Address Host geolocation tools available with the toolkit using NST Wiki traffic data as a data source.
NST Wiki World Users
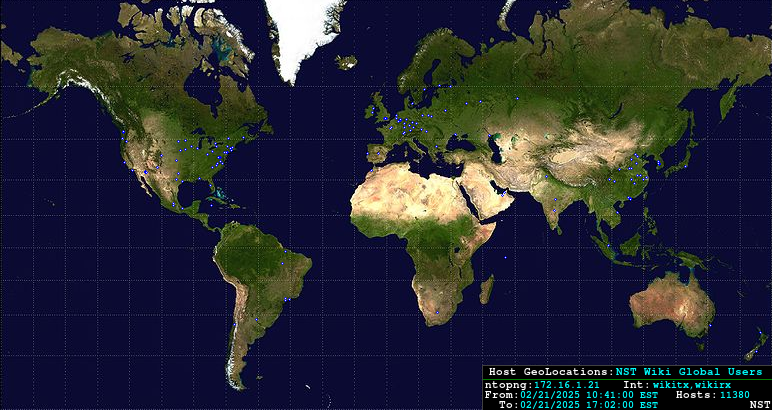
The Mercator World Map projection below depicts geolocated user host systems that have recently accessed the NST wiki site. The map is updated once an hour using a collection window of 24 hours. The data source is an ntopng session running on an "NST 28" probe listening on 2 network interfaces (i.e., wikirx & wikitx) for packet capture. A TP-CU3 Non-Aggregational TAP is inserted between the NST probe and the NST wiki site providing full-duplex traffic access.

The NST wiki traffic for the last 24 hours is also formatted as a KMZ (KML) document that can be downloaded and viewed in Google Earth: "(KMZ Document - NST Wiki Traffic)". Both the Mercator World Map and the KML Document above were produced by the NST script: "nstgeolocate". This script is included in the NST distribution (See the NST Wiki page: HowTo Automate & Manage NST Geolocation Results for further information on geolocating network entities with NST).
NST WebGL Globe
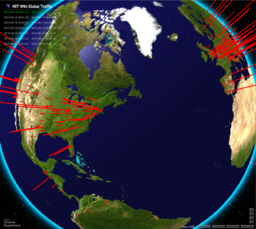
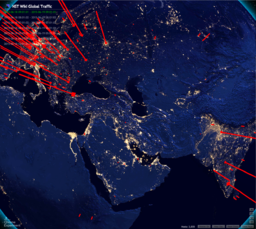
NST now includes a WebGL Globe implementation for the geolocation of IPv4 Hosts. Each hour new NST Wiki host geolocation traffic data is generated and formatted for WebGL Globe usage (i.e. A JSON formatted document.) which can be rendered within a web browser producing images similar to the following graphics of the earth. Each red spike represents Host traffic to and from the NST Wiki site derived from an active ntopng session. Longer spikes indicate greater combined transmit and received network traffic.


Use this link to view the NST Wiki traffic for the past 24 hours as a single series dataset: NST Webgl Globe - NST Wiki Traffic
Use this link to view the NST Wiki traffic as a multi-series dataset for the past 7 hours with a 1 day time interval: NST Webgl Globe (Multi-Series Dataset) - NST Wiki Traffic.
The NST WebGL Globe implementation includes the following features:
- Switch between day time and night time maps.
- Uses a bump map for a realistic earth topography visual.
- Uses a specular map for a realistic sun and moon glint visual.
- Zoom in and out with your mouse scroll control.
- Automatic earth rotation control.
- Configurable selection of the IPv4 Host geolocation data source.
- Manual data spike intensity scale controls.
- The data scale can be dynamically changed between linear and logarithmic.
- A reset button to re-initialize the earth 3D control settings.
- Data can be displayed using either a single series or multi-series dataset.
- All parameters included the initial view location and view distance can be controlled via the URL.
The NST script: "nstgeolocate" now includes the ability to produce NST WebGL Globe JSON documents using ntop / ntopng as a data source. The NST WUI can now dynamically produce on demand NST WebGL Globe JSON documents for these data sources.